Massachusetts Institute of Technology
Department of Urban Studies and Planning
| 11.188: Urban Planning and Social Science
Laboratory |
Homework 2
Extracting & Querying Census Data plus Site Suitability Analysis
INTRODUCTION
The main focus of this homework is Question #2 where we undertake a classic Ian McHarg-style 'site suitability analysis'. See this note on spatial analysis "classics" by John Corbett, Ian McHarg: Overlay Maps and the Evaluation of Social and Environmental Costs of Land Use Change, at the website of the Center for Spatially Integrated Social Science http://www.csiss.org/classics. For our hypothetical 'site suitability analysis' example (in question #2), we will endeavor to find suitable locations for a Cambridge senior center by overlaying the locations of those sites that meet each of several criteria: close to major roads, near the target population, far from hazards, etc.
However, this homework also serves to improve your facility with data manipulation tools including use of MS-Access and the 'summarize' tool in ArcMap. Question #1 focuses on database manipulation and analysis using some of the census data involved in Question #2. There are only two questions in this homework set but each is more complicated than you might think because of all that is involved in decomposing them into doable steps that work as you would expect.
BEFORE FIRING UP ARCMAP - AND LONG BEFORE THE DUE DATES FOR EACH PART OF THE HOMEWORK - PLEASE BACK AWAY FROM THE COMPUTER AND READ THROUGH THE WHOLE ASSIGNMENT. Getting the 'big picture' first will help you develop a better GIS
strategy and will reduce time and energy wasted.
PART I: QUESTION 1 [40 points]
The following table of Senior Citizen poverty statistics was developed from the 2000 US Census using data from Summary File 3 (SF3) - the tabulation discussed in class and Lab #5.
DATA
- Find the relevant demographic data from Census 2000. Open Summary
File 3 : Technical Documentation (.pdf) and search the key word "POVERTY
STATUS". On Page 470, you will find "P87. POVERTY STATUS
IN 1999 BY AGE [17]". There are 17 columns in this section.
Read the description of the variables in this section carefully and decide
which variables you want to use to calculate the percentage of the below-poverty-level
senior.
- Note, also, that the 'Segment' column for variable P87 indicates that the data are saved in file '7' of the 70+ files containing all the census data for one state. (This is the same information that you get from the 'file locator' table that we mentioned in lab and saved here http://mit.edu/11.188/www/labs/lab5/variable_locator.html.)
- To simplify your homework assignment, we have already downloaded the raw text file (ma00007.uf3) and included it in an MS-Access database: hw2_sf3_lite.mdb that is saved in the 'census2k' sub-directory of the class data locker (the same place as the data for Lab #5: M:\data\census2k\hw2_sf3_lite.mdb). This MS-Access database also includes a table blkgrp2t that cross-references all the block groups that are in the 5-town area in an around Cambridge. The construction of the table is explained below in the 'Appendix.'
Question 1a: Fill in the empty cells in the following partially completed table and answer the questions below. Instead of using
ArcMap,
you are free to use other database management software (such as MS-Access).
Note that you will have to make careful use of the 'summarize' command in
ArcMap (or equivalent 'total' or 'group by' commands in MS-Access or other database managers)
in order to compute the correct values for many of the columns. Note, also,
that all five towns are
in the same County, namely Middlesex County in Massachusetts.
Summary of Senior Citizen Poverty Statistics for Cambridge and Abutting
Towns, 1999
| Town |
Number of BG's |
Number of Seniors with Known Poverty Status |
Average of Percentages Calculated for each Block
Group |
| Total |
Populated Block Groups |
Block Group's with seniors with known poverty status |
Total
# with known Status |
# Below the Poverty Level |
Percent
Below |
| Arlington |
44 |
|
|
|
387 |
|
|
| Belmont |
27 |
27 |
|
|
|
|
5.41 |
| Cambridge |
80 |
|
|
9,051 |
|
12.88 |
|
| Somerville |
67 |
|
|
|
1,063 |
|
|
| Watertown |
29 |
29 |
29 |
5,159 |
388 |
7.52 |
6.77 |
| Overall |
247 |
|
|
32,967 |
|
9.74 |
|
Now, take a look at the last two columns and note that the overall percentage of impoverished
seniors within a town is generally different from the town average of the percentages that one can calculate
separately for each block group within that town. Answer the following three questions (in a paragraph or two each).
Question 1b: Explain briefly why the overall average and the average of the block group percentages are likely to be different.
Question 1c: In this instance which method (that is which of the last two columns) tends to be larger? Why?
Question 1d: Which set of numbers are most appropriate for use in our analysis for Question #2? Why?
Question 1e: When calculating the percentages,
think about which denominator to use (i.e., number of block groups,
populated block groups, block groups with seniors with know poverty
status, number of seniors, etc.) List the block group IDs for those
block group(s) with no population, and for those block group(s) for
which the poverty status of seniors is not known. [To clarify this
last part of the question, we mean
those block groups with some population but with no seniors for whom
the poverty status is known.]
Turn in the table with all your computed values added and write at most a paragraph or two for each of questions 1b, 1c, and 1d.
Tips: Filling in the table looks simple enough -- just run some of those
'Field' commands for the requisite block groups. But it will take some thought to determine what each column is measuring, which census rows to include and how to do the summarizing. Another tricky part
of this question is figuring out which block group is within which town.
The block groups can span a town boundary. For this exercise,
we define a block group to be "in" a town if the centroid of the block group
is inside the town boundary. Using ArcMap's "Spatial Join" functionality
sounds like a good idea, but you will have to choose the approriate spatial operator to associate each block group with its town. (See Appendix I below for information about various ways to examine the spatial relationship between block groups and towns.)
PART II: QUESTION 2 [60 points]: The site suitability analysis
A local non-profit group is interested in locating a site for
building a senior center in Cambridge. Given your expertise in GIS, you
are hired as a GIS analyst by this company to help them locate the
best site. After a long meeting with the organization and the community
you agree to run some numbers in order to get a handle on the locations
and characteristics of potentially suitable Cambridge sites. You settle
on the following criteria to get rolling with your site selection
process:
- The minimum area of land needed for the project is 1 contiguous hectares
(1 hectare = 10,000 square meters = 2.471 acres, and 1 acre = 43,560 square
feet).
- Ideally, the site should be located near, but not in, a residential neighborhood.
- The 1999 land use data is available from MassGIS or from class data folder (M:\data\camb_area_lu_1999.shp )
to classify land use. Recall from Lab #2 that you can refer to MassGIS Datalayer Descriptions
and Guide to User Services and, specifically, the documentation for the land use datalayer on the web for further discussion of land use codes. The non-profit organization
has been promised financial assistance from a number of wealthy philanthropists
and has the support of the Cambridge City Council and Mayor. Thus they
are capable of buying any land even if it is already developed. (In other
words, don't worry about whether or not the land is vacant or about how
much it would cost to acquire the land.) You decide to consider any land
that:
- Was classified as open (excluding urban public space and cemeteries),
commercial, or industrial in 1999.
(Hint: Read the land use code definitions carefully -- all of
them.)
- Abuts, but is not actually in, a residential area.
(Hint: Using "Select by Location" with "Are Within Distance Of"
is a way to accomplish this.)
- Accessibility to the project is a major concern for the organization,
especially
given the often limited mobility of seniors. You determine that the project
should be located within 250 meters of a major road.
- MassGIS major road layer, majmhda1.shp, is available
to assist you in determining which places meet this accessibility requirement.
The shapefile is located in the class data directory (M:\data\).
(Consult the MassGIS metadata for this layer
for attribute information about the functional 'class' and administrative type associated with each road segment.)
- The organization is also worried about health risks. They decide that they
want the site to be far (more than 350 meters away) from Toxic Release Inventory
(TRI) sites as identified by the Environmental Protection Agency (EPA) data from
their toxic release inventory databases.
- Data from the EPA's TRI database were used to identify relevant TRI site locations. A shapefile of TRI
facilities for Massachusetts, mass_tri_facilities.shp,
is stored in the M:\data directory. Note that this constraint
applies to all TRI facilities, not just those located in Cambridge
or the abutting towns north of the Charles River (i.e., TRI facilities
in Brookline or the Boston neighborhoods of Allston and Brighton count
too).
- We use the EPA Toxic Release Inventory database for illustrative purposes only -- to show how well-documented external databases can be incorporated
into our own local analysis. In reality, not all TRI sites are health
risks to nearby residents and case by case analysis (based on the specific
nature of a site's toxic releases) is warranted before rejecting locations
proximate to a site.
- The TRI facilities shapefile includes all the TRI facilities for Massachusetts
in the EPA's database (as of October 26, 2000 and for which a latitude-longitude
location was provided) that fell within the borders of Massachusetts.
Not all of the facilities in the EPA's database included latitude-longitude
locations, and some of those with location data did not map to locations
within Massachusetts (as determined by intersecting the points with a
theme circumscribed by the Massachusetts border).
- Accessibility by seniors with limited financial means for joining private
clubs is deemed especially important. Therefore, you decide to narrow the
criteria to focus on census block groups where:
- The percentage of the below-poverty-level seniors (aged 65 or over)
in
the senior population with known poverty status is high. For the purpose
of this assignment, a block group is considered to have
a high percentage of below-poverty-level seniors if the percentage of
below-poverty-level
seniors is at least 10 % above the average for the five towns including
Cambridge, Arlington, Belmont, Somerville and Watertown. For example,
if you found (in your answers in the table for Question #1) that the overall five-town percentage of impoverished seniors
was 15%, then you would be looking for block groups with at least 15%
* (1+ 10%) = 16.5% impoverished seniors.
- For the census block group boundaries, use the Massachusetts Block Groups 2000 layer from MIT Geodata Repository as we used in lab 5. Set the coordinate
system of the data frame containing all your layers to Massachusetts State Plane, NAD 1983 meters
and set the 'map units' to be meters. (Do you understand why we want the data frame to be in Mass State Plane coordinates rather than, say, lat/lon?)
- Use the ma_towns00.shp layer in M:\data directory
as the town boundary.
- As a tip, you may want to select a subset of features in both the Block
groups layer and the ma_towns00.shp layer that are relevant to this problem,
export them to your own working directory, and add them to ArcMAP. In
this way, the operation in ArcMAP is faster and at the same time, you
will have write permission on these files so that you can modify them
when needed.
- Find the relevant demographic data from Census 2000.
- Open Summary
File 3 : Technical Documentation (.pdf) and search the key word "POVERTY
STATUS". On Page 470, you will find "P87. POVERTY STATUS
IN 1999 BY AGE [17]". There are 17 columns in this section.
Read the description of the variables in this section carefully and decide
which variables you want to use to calculate the percentage of the below-poverty-level
senior.
- Note, also, that the 'Segment' column for variable P87 indicates that the data are saved in file '7' of the 70+ files containing all the census data for one state. (This is the same information that you get from the 'file locator' table that we mentioned in lab and saved here http://mit.edu/11.188/www/labs/lab5/variable_locator.html.)
- To simplify your homework assignment, we have already downloaded the raw text file (ma00007.uf3) and included it in an MS-Access database: hw2_sf3_lite.mdb that is saved in the 'census2k' sub-directory of the class data locker (the same place as the data for Lab #5: M:\data\census2k\hw2_sf3_lite.mdb). This MS-Access database also includes a table blkgrp2t that cross-references all the block groups that are in the 5-town area in an around Cambridge. The construction of the table is explained below in the 'Appendix.'
- In order to assure access to the senior center to a large number of senior
citizens, we are interested in looking at the data for the four towns (north
of the Charles River) that border Cambridge -- Arlington, Belmont, Somerville
and Watertown, as well as Cambridge itself. However, because the political
support for the facility is so strong in Cambridge (the Mayor and Council
being behind it), the facility should be located within the Cambridge city
limits.
Use ArcMap and the various layers that we have used in class exercises to undertake
a basic site suitability analysis. (Feel free to augment your maps with some
other map layers stored in the class data directory in order to improve the visual quality of the presentation - but stick with the site selection criteria listed above).
Question 2a: First, prepare 3 maps showing the locations that are acceptable
based on the criteria identified above. Map these criteria separately:
- proximity to major roads and distance from the TRI Facilities.
- appropriate land use characteristics
- block groups having a high percentage of seniors below the
poverty level.
Question 2b: Next, prepare a fourth map that shows those Cambridge
locations that meet all these criteria as well as the
1-continguous-hectare constraint.
Question 2c: Along with the maps, provide a page or two (not a
treatise) of discussion concerning:
- any choices or interpretations that you made in generating the
suitable locations and which you feel bear some explanation, and
- your conclusions from this initial analysis regarding suitable
sites. Regarding your conclusions, don't just pick one site--there
isn't a definitive 'best site' given the criteria we've suggested. Be
sure to include some interpretation regarding the extent to which the
analysis helps you focus on one part of town, on one or another
criterion, on a set of proximity issues that might forecast special
interest concerns/complaints, etc. Would you suggest tightening or
relaxing some of the criteria? Can you suggest important considerations
that are not well captured in this suitability analysis
Hand in a discussion of the answers to question 2c along with the four
maps.
FAQ and other Suggestions
- You are required to put all the maps into PDF
format and turn them in to Stellar along with your textual discussion and tables. Be sure to check the PDFs since, sometimes, fonts and symbols get dropped. (In that case you may have to resort to JPEG output). You do *not* need to turn in any paper output for this assignment..
- You will be graded on the quality of both your
analysis (visuals and text) and your visual presentation.
- Doing a good job on this assignment will require that you look
critically at the results you get. Using your common sense is a must!
- Think hard about the order in which you need to undertake
various steps before you attempt them in ArcMap. You may save
yourself considerable time depending upon the order in which you do the
various overlay and site suitability steps. Organizing, naming, and saving partial results will make it much easier to redo and reassemble your work as you refine your layers and analyses. This homework contrasts
with the labs in that we do not spell out the step-by-step procedures
you need to follow to reach the result. Hence, this assignment will
require more thinking on your part.
- This homework set is the major out-of-class assignment during the
next few weeks and you should spread the work out during that time.
We expect it to take between 15 and 20 hours total. Try more than one approach, and reflect on what you've done and what it means. There
isn't a single right answer to the site suitability question and there
is more than one way to do many steps (as well as a few dead ends). If
you do spread out the work, you'll find the exercise to be much more
enjoyable.
Need Help?
If you need help, and you think that your question might be of interest to
the whole class, send e-mail to 11.188@mit.edu. If you would prefer to
ask just the class staff, send e-mail to 11.188staff@mit.edu. Please don't be shy
about asking the staff for help if you are struggling with understanding the assignment
or having trouble with a particular aspect of ArcMap. We've heard many stories
of students struggling for many hours over minor issues that had easy solutions.
We'd like to avoid these misadventures, so please contact us sooner rather than
later if you get stuck. (When you finally get unstuck, spend a moment reflecting on what you could have done to get unstuck earlier if you had the vocabulary, GIS understanding, or roadmap of ArcGIS to use the various help files and references.) Also, we recognize the value of group work and encourage
study group discussion of the homework as well as lab exercises - but we require that you turn in individual work that reflects
your own learning and hands-on discovery.
Appendix I: Determining which block groups fall within which town
As indicated in the homework text, the Massachusetts town boundaries do not line up precisely with the US Census block group boundaries even though, in almost all instances, the block groups fall with a single town. These differences are known as a 'sliver problem' and, in this case, the reason for the problem is that the census block group boundaries are much less detailed and precise as the Massachusetts Town boundary layer. The following graphics illustrate the problem. [They use a shapefile fivecities.shp containing the borders of the five municipalities in and around Cambridge and north of the Charles River. This shapefile was exported from the MassGIS matown00.shp shapefile and is available in the class data locker.]
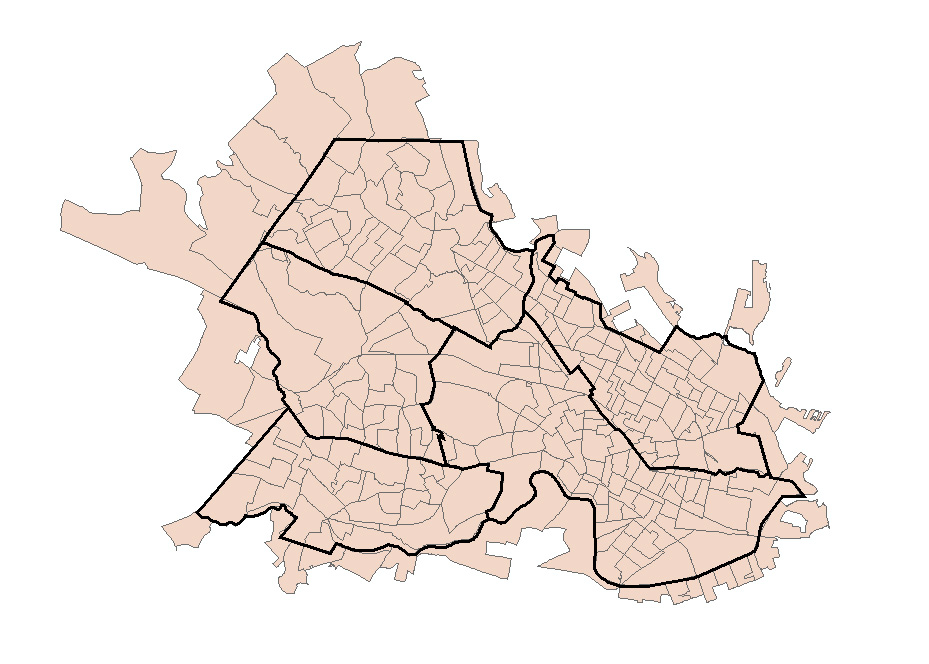
The graph above shows the five towns in and around Cambridge (and north of the Charles river) together with all the block groups that
are selected using "Select by Location" function with "intersect"
specified as the topological relation between two layers. Many block groups
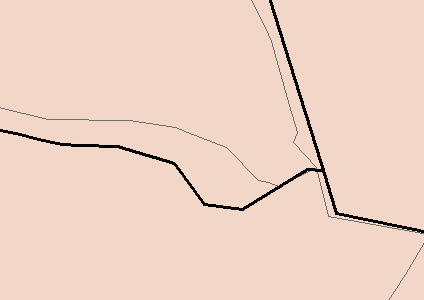
outside of the five-town boundary are also included! If you zoom into a small
area at a town boundary, as shown below, you will see why so many extra block groups
are selected. The two themes have different levels of detail and you there is a 'sliver' problem in trying to reconcile the common boundaries.
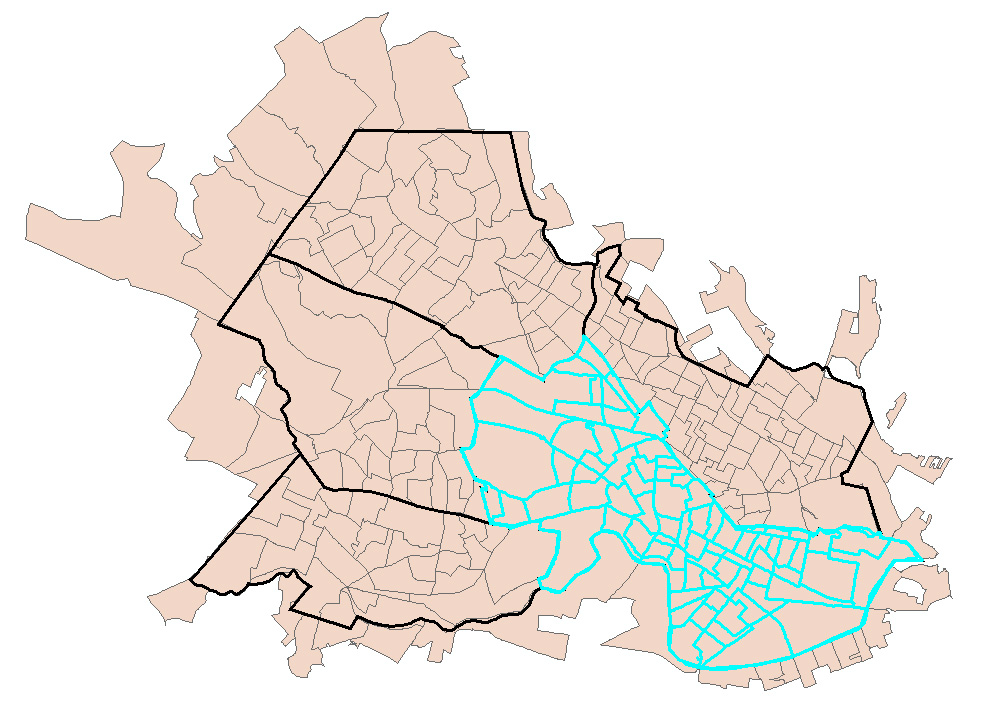
For your convenience,
we have provided in the ms-access database, hw2_sf3_lite.mdb, a cross-reference table, blkgrp2t, that was created by doing a "Select
by Location" operation for each of the five towns, with "have
their center in" as the
topological relation. The table has two columns: bkg_key has the state+county+tract+block-group identifier and town has the corresponding town name. For example, the graph below
shows the block groups
that "have their center in" Cambridge. A new field "Town"
is created and its value is set to be "Cambridge" for those block
groups.
This method works when only a handful towns are considered. If you want to
analyze hundreds of towns, you don't want to undertake this town-by-town selection process by hand.
There are more advanced tools to solve this problem such as creating
a new shapefile that contains points representing the centroid
for each block group in Middlesex County and then doing a spatial
join between this new Centroid layer and the town
layer. However, creating the centroid layer from the
blockgroup shapefile is too much of a distraction for this homework set. (We will use this example later in the semester to demonstrate the use of simple VBA
scripts to add the X,Y coordinates of the centroids to the attribute
table, so we can then save these columns as a new data table, and then use
the Tools/Add-XY-data option in ArcMap to make a point shapefile of
the centroids. Doing all this is too complicated and distracting
to be part of this homework, but each step is well explained in the ArcGIS help files.)
Written in 1996-2001 by Kamal Azar, Joseph Ferreira, and Tom Grayson
Modified by Myounggu Kang on 10 October 2002 incorporating Census 2000
Modified 2003-2010 by Jeeseong Chung, Jinhua Zhao, Shan Jiang and Joe Ferreira.
Last modified by Joe Ferreira on 6 October 2010, and Shan Jiang on 17 October 2010
Back to the 11.188
Home Page. - Back to the CRON
Home Page.