Massachusetts Institute of Technology
Department of Urban Studies and Planning
| 11.188: Urban Planning and Social Science
Laboratory |
Lecture 2: Cartography, Coordinate Systems, Relational Databases,
& Data Management
February 13, 2019, Joe Ferreira
(including notes by Prof. Joe Ferreira,
Prof. Mike Flaxman, Laura Delgado, and former Visting Prof. Zhong-Rhen
Peng)
Administrative notes regarding lab exercises and schedule
- See one of us IF you do not have an MIT login
account
- Next regular Lab (lab #2) is on TUESDAY
(Feb.19) which follows a Monday schedule: Lab session
from 2:30-5:00 pm in Room W31-301 with lab exercise presentation for
45-60 minutes starting at 2:35
- Lab #1 is due that Tuesday (Feb. 19)
- EXTRA LAB HOURS:
- Friday, 10-noon pm in Room 9-554 (5th floor computing lab)
- DUSP (CRON) and W31-301 machines are available 24/7 but you need
access
- Office Hours:
- Joe Ferreira (in Room 9-532): Thursday 10:30 - noon
- Rida Qadri: TBA based on your feedback
- Lab Exercise grading
- we aren't going to grade every detail
- you'll get a 'check' = okay, 'check-plus' =
especially good, or 'check-minus' = not as complete as we had
hoped.
- we will post lab exercise comments after each
lab is graded
- all together, the lab exercises count for 25% of
the semester grade.
- Lab Exercise purpose:
- quick start with basic ArcGIS tools and features
within MIT's networked info infrastructure
- highlight important ideas and methods
- assist you in becoming more self-sufficient
with ArcGIS help pages
- as semester progresses, they will be less
cookbook and a little more open ended
- Don't just push the buttons to get
the 'right' answer - pause to think about what
you are trying to do, what info/tools are needed, why ArcGIS is
organized in a particular way, and why that way may be different
than you originally anticipated
Outline of Today
- Mostly lecturing from these notes with some
illustrations using ArcMap and Lab #1 data
- GIS Example:
- Site Selection for
Low Cost Grocery Store Chain
- Cartography: Map
elements and thematic mapping issues: symbology, classification, and
normalization
- Projection and coordinate systems
- Database concepts and spatial
reference systems
- Relational Database modeling
- Structured Query Langauge (SQL)
- Joins and Relates in ArcGIS
GIS Example:
(1) Site Selection for Low Cost Grocery Store
Chain
- Conceptual Model
- Brainstorm
criteria for "good" locations
- Case
Study Example
- Think
about these marketing slides?
- Is
the methodology or analytic scope overstated?
- What
considerations are omitted, shortchanged, badly measured?
- From
whose point of view is the siting service helpful or hurtful?
Map
elements and thematic mapping:
Symbology, classification, and normalization
Elements
of the Map
Scale
 Ratio
Scales
Ratio
Scales
1:10,000, or 1:100,000 or 1/100,000
No units,
just one unit on the map equals a designated number of units on the
ground.
Verbal Scales:
 One
inch represents 2,000 feet (1:24,000 because there are 24,000 inches
in 2,000 square feet).
One
inch represents 2,000 feet (1:24,000 because there are 24,000 inches
in 2,000 square feet).
One
centimeter represents 20 kilometers (1:2,000,000)
Printout vs. onscreen:
10 foot pixel + 72 pixels per inch onscreen
==> One inch represents
720 feet (1:8,600) -
But some screens have
higher/lower pixel densities; not all screens have square pixels;
also, screendump to printer will change scale since printer will
have different dot-density than the screen
Beware! Good GIS
software will try to match screen and printer properties to
software settings so screen and printouts will show appropriate
scale and show correct scalebars. For the scale to be meaningful,
display units and hardware choices must be properly identified.
Large
Scale or Small Scale
In general,
Large
scale: >= 1:24,000 (the representative fraction is large,
but they are good for *small* area
representation - city block)
Small
scale: <= 1:500,000 (good for *large* area representation - metro
area)
Important concept: Minimum
Mapping Unit" (MMU)
- The smallest feature chosen to map (anything smaller is merged)
- Example: Oregon GAP Vegetation Map
- based on 30m Landsat7 data - choose 1 ha MMU
Typical Scales Used
In Metric System:
1:10,000 (example: German national basemaps individual houses shown)
1:25,000 ... 1:100,000
In American System:
1:9,600
(one inch represents 800 feet)
1:24,000 (one inch represents 2000 feet) typical USGS quad sheet
1:62,500 (one
inch represents slightly less than one mile)
Key
Cartographic
Principals
Maps are a medium of communication
So
know your audience
Or if you dont/cant, use the 10 foot
rule
Can an average citizen read &
comprehend E sized plot at 10?
Or a page print at 8.5x11 font size at
least 12 point
A good map should never be a GIS Data
Dump
Selective emphasis is key
The hard part is removing
data, when in doubt - delete
Divide mapped elements into figure / ground
Figure = Foreground elements the essential story of the map
Ground
= Background elements provide context, but dont overwhelm
==>
Use visual symbols, colors,
and shades to emphasize foreground,
& minimize background clutter
Colors and Categories
Human cognitive limit / rule of thumb:
Try to limit the number of thematic colors
- If not possible, try creating logical visual
subgroups
- example: housing in 3 shades of orange, commercial 3 shades
of red, etc.
- Hard to distinguish more than 3-4 tones within
same hue
- Even harder when your map is reproduced in grayscale
ArcGIS color defaults are *random* saturated
colors
- Tip #1: desaturate colors,
especially background colors or those covering large areas of the
map
- Tip #2: reserve bright,
saturated colors either for foreground elements, or small polygons
- Tip #3: turn *off* the outline
of polygons, particularly for background polygons or small
polygons
Six Principal Visual Variables
- Size, Shape, Graytone Value,
Texture, Orientation, Hue
- How can you use these dimensions to symbolize
points, lines, polygons?
Use contrasting symbols to
portray geographic differences
For qualitative differences
Use shape, texture and hue (e.g., land use types).
For quantitative differences
Use size to
show variation in amount or count
(e.g., population, number of crimes),
Use graytone
or hue to show differences in ratio or intensity
(e.g., proportion of household in poverty, population density).
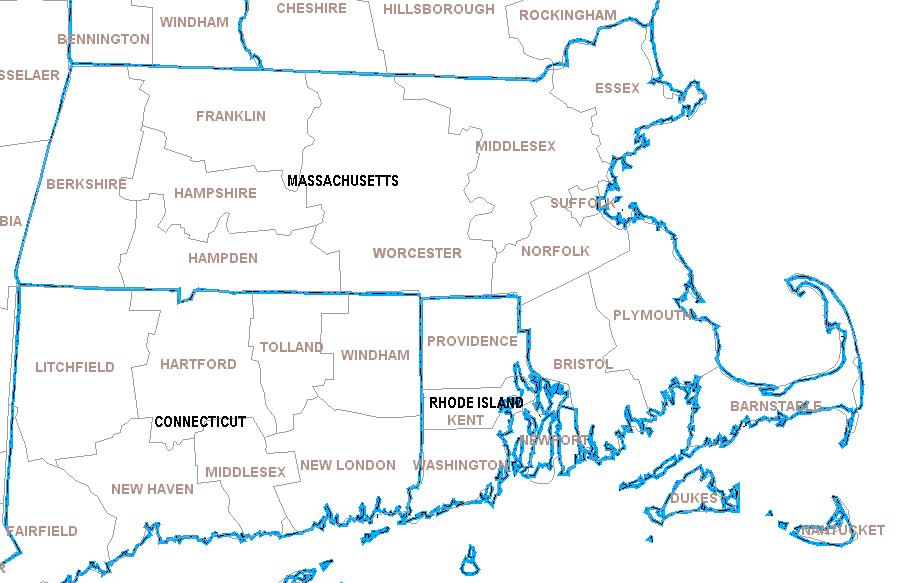
Southern
New England Counties
- Thematic mapping (again) - simplest display
of spatially varying phenomena
- Note
use of ArcMap 'help files' regarding thematic map
types & classification choice
- Layouts: Features of a good map (lots more to
good cartography - see references)
- Title,
Legend, Scale Bar, North Arrow, Data sources
- Your
name or organization
- Other
feature labels and annotations, including classification method
-
For more, see online help and class readings on cartography
- Best general
reference on Graphic Communication (beyond cartography)
Map
Projections and Coordinate Systems
Datums,
Map Projections, & Coordinate Systems
What is
the minimum information needed to precisely determine
location
on the surface of the planet?
Need *both* a known coordinate system
and a known model of the earths surface
If you only know one, you can be hundreds of meters off target
-literally
An
Ellipsoid or a Datum are abstractions of
the surface of the earth
WG84 (the
World Geodetic System of 1984) is a standard ellipsoid.
In North America, the
most recent ellipsoid data it is called the North American Datum of
1983 (NAD83) (the earlier version is NAD27).
Geographic
Reference System: Latitude and Longitude
Axis: the
center of earth rotation.
Equator:
The plane through the center of mass perpendicular
to the axis.
Longitude:
lines slicing the earth parallel to the
axis, and perpendicular to the plane of equator.
The line
going through Greenwich in
London has 0 longitude.
Range from 0 to 360
degrees, or 180 degree west (-) to 180 degree east (+).
Latitude
Latitude
is defined based on ellipsoid representing the shape of the earth.
See: Prof. Peter Dana's notes on projections
and coordinate systems ( U.
of Colorado
) http://foote.geography.uconn.edu/gcraft/notes/coordsys/coordsys_f.html
<Click the images below to enlarge...>
Latitude
definition:
A line drawn
through a point of interest perpendicular to the ellipsoid at that
location, the angle made by this line with the plane of Equator is the
latitude of that point.
Ranges
from 90 degree south (-) to 90 degree north (+).
What
do Latitude and Longitude mean?
Two points on the same
longitude, separated by one degree of latitude are 1/360 of the
circumference of earth apart, or about 111 km apart.
One
minute latitude is 1.86 km.
One
second latitude is 30 m.
For
the same latitude, one minute of longitude separation corresponds to different
distances depending on the latitude (111 km at equator, nothing at the
poles!).
Nowadays, latitude/longitude often expressed in decimal
degrees.
Distance
calculation using latitude and longitude
- Latitude -90≤Ø≤90
- Longitude -180≤λ≤180
- Arc distance between two points on the earth surface
(spherical):
Cartesian Coordinate System
- Assign two
coordinates to every point on a flat surface.
Map
Projections
- Map projections
transform the curved, 3-D surface of the planet into a flat, 2-D
plane.
Note, that map projections distort map scale in various ways
- Transform
a position on the Earths surface identified by latitude and
longitude (Ø, λ) into a position in Cartesian coordinates (x, y).
- x = f (Ø, λ)
- Y
= g (Ø, λ)
- Map
projections necessarily distort the Earth and the map scale.
For additional information,
see example from Prof. Peter Dana's notes (U. of Colorado)
http://http://foote.geography.uconn.edu/gcraft/notes/mapproj/mapproj.html
NOTE: There is no need to memorize the formulas or properties of
various coordinate systems. Just understand the concepts and how to
find more information about specific cases and coordinate conversion
Map
Projection Classifications based on preservation properties
- The conformal property, preserves the shapes of small
features on the Earths surface (directions). This is useful for
navigation. E.g., Mercator
projection and Gnomonic projection.
- The equal area property, preserves the areas. This is
useful for analysis involving areas like the size of a land parcel,
e.g., Goodes projection.
- Any projection can have
either conformal property or equal area property, but
not both.
Map
Projection classifications based on physical surface models
- Cylindrical projections -- wrapping a cylinder of paper
around the Earth, projecting the Earths features onto it, and then
unwrapping the cylinder;
- Azimuthal or planar projections -- touching the Earth
with a sheet of flat paper;
- Conic
projection -- wrapping a sheet of paper in a cone shape around the
Earth.
- All
three types can have either conformal property or equal
area property, but not both.
Unprojected projection:
Plate Carrée or Cylindrical equidistance
Projection
- Geographic
Coordinate System (GCS) uses longitude as x and latitude as y.
- Heavily distorts image of the Earth.
- It does not have either conformal or equal area property.
- But
it maintains the correct distance between every point and the
Equator.
- Serious problems (distorted area, direction and other properties)
can occur when doing analysis using this projection.
The
Universal Transverse Mercator (UTM)
Projection
- Projected
by wrapping a cylinder around the Poles, rather than around the
Equator.
- There are 60 zones. Each zone is 6 degree wide and wrapped
along a particular line of longitude.
- The projection is conformal, the scale
is the same in all directions.
- UTM
coordinates are in meters, making it easy to make accurate
calculations of short distances between points.
- UTM
projections have more problems at high latitudes.
State Plane
Coordinates and other local systems
- UTM
is still not accurate enough for small area surveying.
- During
1930s, each US state adopted its own projection and coordinate
system, generally known as State Plane Coordinates (SPC).
- Each state chose its own
projection based on its shape to minimize distortion over the area
of the state.
- Some states have more than one internal zone.
- The
North American Datum 1983 (NAD83) is commonly used for SPC.
Converting Georeferences
- Two
datasets can differ in both the projection and the datum, so it is
important to know both for every dataset (and the data can be
expressed in feet or meters with
different origins!)
- Use
coordinate conversion to combine datasets that use different
systems of georeferencing.
Keep in mind, changing projections
means the system must convert projected coordinates back to lat/lon
(geographic) and then re-project
into another projection/datum.
- Convert
into projections that have desirable
properties, e.g., no distortion of area, for analysis.
More
info on Coordinate systems and projections
- Coordinate
Systems
- Datums
& Units
- Projections
Relational
Database Modeling
Limitations
of 'flat-file' data model &
motivation for relational model (for attributes)
- One 'flat file' data table for each map
layer is too simple a data model
- From lab exercises:
one-to-many issues
- some houses in sales89 may
have sold more than once!
- but, map has only one dot per
house
- what sale price is correct?
average, most recent sale, inflation
adjusted average, ...?
- An example of the problem using ArcGIS!
- Typical urban planning context:
many-to-many issues
- Parcels can be owned by one
or more owner
- Owners may own more than one parcel
- Owners change when parcels are
sold
- How do you find all owners
with more than one foreclosed parcel since
2007
- Strategy: Relational Data Model
(i.e., linked tables)
- Retain tabular model for textual data but
allow many tables that can be related to one another via common
columns (attributes)
- Allows augmenting attribute tables by
adding additional data
- Handles one-to-many issues (where rows have
different meaning in joined tables)
- ArcMap strategy: (subset of fully relational model)
- Maintain one-to-one link between textual data and associated
geometry for a class of objects
- Simplify one-to-many issues when joining in additional
tables and hope for the best
- Keep-or-remove feature when joined table has no match
(e.g., homes without any sales transaction)
- Ignore all but one match when more than one joined row
matches a feature (e.g., multiple sales of a single home)
- Create collapsed 'summary' table first, before joining new
table to spatial features
- For multiple sales example:
- create 'summary' table with one row per house
and columns for number of sales, maximum price, average
price, etc.
- then join summary table via house ID to the original
sales table
A Table (relation)
Attribute
name
Rows: tuples that
specify particular relations among values of each attribute
Columns: attributes describing a feature of
interest
Domain: data types and range of values for an
attribute (like integer, strings, floats, dates, city names, etc.
)
Relational Databases
- A
relation is a finite set of tuples
associated with a relation schema in a relational database (that
is, a 'table' where each row is a tuple and the columns are the
things that are related)
- A
relation schema defines the structure of the
relationship, and is composed of a set of attribute names and a
mapping from each attribute name to a domain (that is, the
possible values of that attribute)
- A
relational database is
a collection of tabular relations, or tables.
- A
database schema is a set of relation schemas.
Structured Query Language (SQL)
- To
define the database scheme (data definition),
- To
insert, modify, and retrieve (SELECT) data from the database (data
manipulation).
SELECT columns
FROM tables
WHERE row conditions and
joins are matched
GROUP BY
non-aggregated columns
ORDER BY certain columns
- Can
get complex (subqueries in 'from' and 'where' clause, 3+ tables,
...)
- Can
be especially powerful when rows in each table have different
meaning
e.g.,
join city table to state table, parcel table to owner table, or
house sales table to house table
<<<
lecture ends here - additional notes below are extra >>>
Other (abstract) Database Concepts
(generally beyond scope of class)
Distributed databases and Federated
databases
n
Distributed
databases refer to one database (or data
replicates) that are distributed across multiple sites.
n
Federated
databases refer to many similar databases that are distributed across
multiple sites but are more loosely coupled and additional rules may
be needed to cross-reference tables meaningfully
n
Federated
databases are also called distributed relational database with
fragmentations.
Relational data model
(our focus)
n Collection of
interrelated tables
n
Highly
structured data schemas and data types with data dictionary
n
We'll
examine US Census Bureau examples in Lab #5
Relational Database as Entity-Relationship Model
n
E-R
model sees the world as inter-related entities (tables);
n
Use
MS-Access to build E-R diagram for the three city/state tables: lec5_cities.mdb.
n
Entities
(or entity types like cities and states in our example) are related
with each other by a relationship (linking primary and foreign keys -
e.g, which city is in which state)
n
E-R
model uses E-R diagrams to describe relations between entity types
(generally one-to-many connections)
n
E-R
model describes the static state of the entity types.
Object-Oriented Model
- one alternative to E-R for RDBMS
n
Object-oriented model sees the world as
inter-related objects.
n
Object
is dynamic and has its own lifespan. Hence OO model is used to deal
with the dynamic nature of real-world object.
n
Object = static state + functionality
n
Object with similar behaviors are organized into types,
a semantic concept.
n
Object Class = data structure +
methods, an implementation construct.
Other Noters about RDBMS and relational tables
in ArcGIS
Joining and Relating Tables in ArcGIS
n
Join
in ArcGIS appends the attributes of the
non-spatial table to the spatial (layer) attribute table.
n
Relate
in ArcGIS does not append attributes;
only establishes a logical relationship so that when you select one
record in one table you can see the matching records in the other
table.
Don't get confused between ArcGIS 'relate' (which describes the
relationship between two tables, and RDBMS terminology where
'relation' = a table)
When to Use Join and Relate
n
Relate
is preferred if the non-spatial table is maintained and updated
constantly while the spatial data is not. (e.g., Mass towns
shapefile plus summary table with data for each town)
n
Use
relate when the relationship is many-to-many.
n
Use
relate when you have a very large non-spatial table and you don't
need all the attributes in the table.
n
Columns in 'related'
table cannot be thematically mapped - they must first be 'joined' in
n
In
other situations, you could use either.
Last modified 12 February 2019 [jf]
Back to the 11.188 Home Page.
Back to the CRON Home Page.


