- In Lab #7 you convert Yelp points of interest into an ArcMap shapefile:
- Yelp output is a CSV
text file (comma separated values) that can be read
into Excel
- Use Excel functions to
prepare data for insertion in ArcMap
- Make sure lat/lon are formated as numbers (see lab notes)
- In other cases, lat/lon may be in one field & Excel functions can parse them:
- For example: =MID(G2, 5, 9) and =MID(G2, 21, 10)
- ArcMap only reads Excel files saved as *.xls (not the latest *.xlsx format)
- If they still show up as text in ArcMap (text is left justified), go back to Excel and force coversion (e.g., =1.0*b2...)
- Add adjusted worksheet
from Excel into ArcMap
- Right-click: Display XY data to convert to points
- Remember to specify geographic coordinates (lat/lon, North America, NAD83)
- Results produce an 'events' layer which shows points
on map but is not a
shapefile
- Still need to do "Data / export data' into a shapefile before it is saved as a real shapefilef
Network Analysis - Expand discussion of Network Analysis tools from previous lectures
- Encoding proximity
using a network (or graph) model, facilitates
certain types of connectivity
analyses
- Find shortest path along streets from Point A to Point B
- Find shortest path through N cities (Traveling Salesman problem)
- How far can you get in 30 minutes
- Many transportation analyses use network data models
- Many hydrological analyses use network data models (runoff, flow, ...)
- Additional information on Network Analyst below
Network
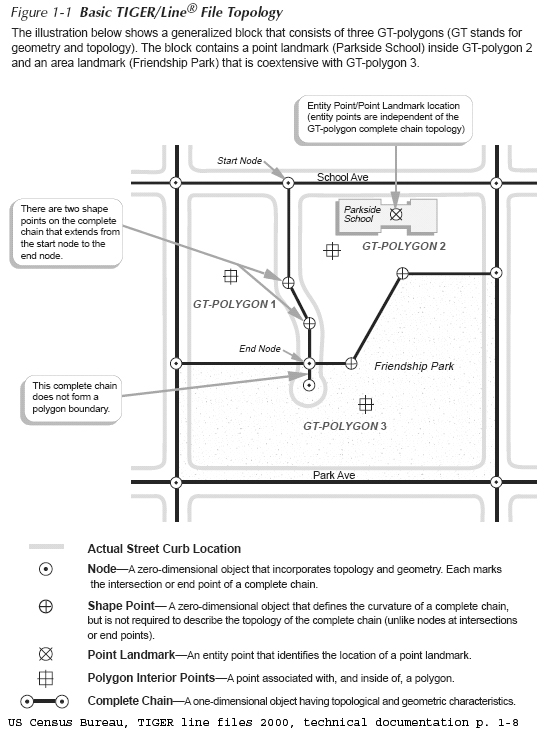
Example: using US Census Bureau, TIGER Line Files
- Geocoding Strategy using TIGER files (from earlier lecture
notes)
- Encode road network as street centerlines links connecting nodes (usually intersections)
- Attach address information to each street segment
- Use 'in reverse' to match street address to street segment to get approximate X,Y location
- TIGER: Topologically Integrated
Geographic Encoding and Referencing
system
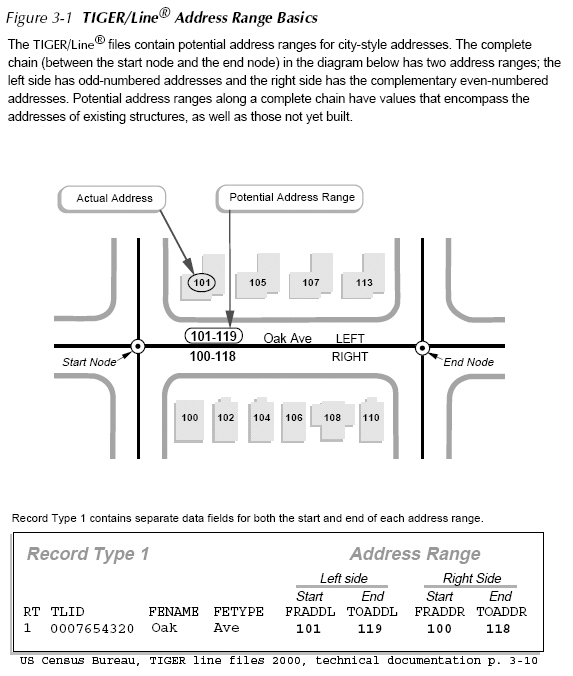
- Examine attribute table and note columns for to/from information
- http://www.census.gov/geo/www/tiger/
- US Census Bureau TIGER line file 2000, technical
documentation
- at Census: http://www.census.gov/geo/www/tiger/rd_2ktiger/tgrrd2k.pdf
- in class locker: http://mit.edu/www/data/census2k/tiger_tgrrd2k.pdf
- Illustrative Example
Street centerline road segmentsAttaching address ranges to road segments
What
is ArcMap's Network Model?
A shortest
path is the shortest (or least 'cost' path) from
a source node (origin) to a destination node. In
practice, pathfinding seeks the
shortest or most efficient way to visit a sequence of
locations.
A tour
is an enclosed path, that is, the first node and the final
node on the path are the same node on the network.
A
stop is a location visited
in a path or a tour.
Events
or locations may be viewed as collection points (e.g.,
'origins' or 'destinations' ) where certain resources are
supplied or consumed.
A
turn on a network is the transition from one arc to another
arc at a node (there are 16 ways in which two intersecting
(one-lane) roads can allow vehicle flow among the 4 links
that 'connect' to the one node).
'Location-allocation'
models often use network representation of connected places
in order to determine the optimal locations for a given
number of facilities (e.g., stores, restaurants, banks,
factories, warehouses, libraries, hospitals, post offices,
and schools) based on some criteria for assigning people to
the the 'nearest' facility.
- For Lab #7, you use the GoogleWay API to run their shortest path algorithm to compute the walking distance from 'home' to each restaurant (obtained using Yelp points of interest).
- Another
common task is to create a 'service area' that comprises
all places that can be reached within X minutes from a
specific location. For example, how far from 77
Mass Ave can I get on public transit within 30
minutes. Take a look at the 'Make Service Area
Layer' tool in the 'Analysis' section of Network
Analyst. Here are links from earlier
lectures to maps that display these types of results:
- RedFin (real estate marketing) site to find jobs with 30 minutes without car: https://labs.redfin.com/opportunity-score?south=42.22947350329647&west=-71.20178445835722&north=42.48874784471439&east=-70.98449334164275&zoom=12
- Transit
heat map (of one-hour access): http://www.transitheatmap.com/
Under-the-cover look at
Web Mapping
- We have already used:
- Several
"Web Mapping Services" in our ArcMap documents
- Javascript and Leaflet libraries to draw maps in Lab #7
- More tutorials are available on DUSPviz: duspviz.mit.edu
- What
is the information exchange between your browser and
backend resources?
- Let's look at the major roads images we have used from MassGIS
- RESTful API design (REST=Representational State Transfe
- 'Stateless' information exchange (fire-and-forget lightens server workload)
- AJAX language: asymmetric javascript and XML
- Send URL with parameters included
- http://giswebservices.massgis.state.ma.us/geoserver/wms?dpi=120&request=GetMap&layers=GISDATA.EOTMAJROADS_ARC&srs=EPSG:4326&bbox=-71.1,42.35,-71.0,42.37&width=1000&height=300&format=image/png&service=wms&transparent=true
- Do you recognize the meaning of the parameters?
Play with the values...
- http://giswebservices.massgis.state.ma.us/geoserver/wms
- http://giswebservices.massgis.state.ma.us/geoserver/wms
- dpi=120&
- request=GetMap&
- layers=GISDATA.EOTMAJROADS_ARC& (or GISDATA.MBTABUSROUTES_ARC&)
- srs=EPSG:4326&
- bbox=-71.1,42.35,-71.0,42.37&
- width=1000&
- height=300&
- format=image/png&
- service=wms&
- transparent=true
- Get back XML tagged values (in this case a png image of the desired map sized to fit in display window with one transparent color)
-
Useful tools for 'publishing' project work
- Enable interactive manipulation of maps within browser, PDF document, etc. without 'running' GIS software
- Leaflet: javescript library to facilitate data exchange with backend web server (such as MassGIS server)
- See DUSPviz tutorial:
- Web Mapping workshop tutorials: http://duspviz.mit.edu/tutorials/
- Leaflet tutorial: http://duspviz.mit.edu/web-map-workshop/leaflet-js/
- Carto: additional libraries plus backend PostgreSQL (PostGIS) database access
- See DUSPviz Carto tutorial: http://duspviz.mit.edu/web-map-workshop/databases-leaflet-cartodb/
- ESRI ArcOnline web services
Advanced Raster Analysis (From April 1 lecture notes but not covered)
Summarize grid cells values by fixed geometries using zonal statistics
- Vector case example: summarize suitability across each census blockgroup
- Use 'zonal statistics' to average grid cell values within each blockgroup polygon
Finding patches using RegionClass command
- What if we wanted to summarize by real city blocks and only had road centerlines
- Create block polygons from road centerlines using 'line coverage to region' RegionClass tool (requires ArcInfo license)
- Use block IDs to distinguish each 'patch' so zonal sum will compute block average
Moving window analyses
- Sometimes we don't have a fixed geography
- Want to summarize clusters of occurrences
- Example: land use mix (within classic pedestrian 1/4 mile)
Cost-over-Distance measures
- Some paths are more 'expensive' to traverse than others
- Simplest form: mask out excluded areas, assume cost per cell is equal elsewhere
- Alternative: weight distance across cell (or road segment) by cost to traverse
- E.g. use speed limit to estimate travel time; or penalize steepness, bad soil, flood risk, etc.
- could be done for raster or vector (street network) models
- In general, urban grid makes accessibility relatively even
- But note case of Charles River
- Online Example: RedFin link shown in previous section to find 30-min job count