Massachusetts Institute of Technology - Department of Urban Studies and Planning
|
11.188: Urban
Planning and Social Science Laboratory
|
|
11.205: Intro to Spatial
Analysis (1st half-semester)
|
Lecture 7: Spatial Analysis (Vector Models)
March 4, 2020
(Joseph Ferreira, Jr., based, in part, on notes by Visting Prof. Zhong-Rhen Peng from Fall 2003)
Administrative Notes:
- Lab and Homework Schedule
- Hwk #2 part 1 due Today
- Lab #4 is due next Monday (March 9)
- Lab #5 (vector analysis) next Monday is due Friday March 13
- In-class (open book) test on Monday March 16
- Hwk #2 part 2 due Wed. March 18
- END OF 11.205 (Friday, March 20)
- <--- Spring Break --->
- Very preliminary project topic idea due Monday, March 30
- Lab #6 (raster analysis) on Mon. March 30 and due April 6
- This and the rest are required ONLY for 11.188 and 11.520
- Lab #7 (GIS data gathering) on Mon. April 6 and due Mon. April 13 (Part 1) and Wed. April 22 (Part 2)
- Hwk #3 part 1 due Wed. April 8
- Hwk #3 part 2 due Wed. April 15 (last homework)
- Test preparation:
- in Lab (hands-on) open book test on Monday, March 16
- last two years of tests (and answers) are available: http://web.mit.edu/11.188/www/test
- Project Schedule
- Mini-proposal (title+one-paragraph project idea) due just after Spring break
- Project Title plus draft Abstract due by April 15
- Project presentations on Monday and Wednesday, May 6 & 11
- Project writeup due by May 11 (and no later than May 13)
- Feedback and Comments
- ArcMap tips
- In 'layer properties' symbology tab (for
'quantities') click 'symbol' column heading and then
- choose 'flip colors' to switch ordering of colors
- choose 'properties for all symbols' to adjust fill or outline colors for all categories
- Likewise, click on 'Label' in symbology tab to format all the labels
- Good practice to state classification method (quantile, natural breaks, etc.) in annotation (along with data sources,...)
- In 'layer properties' symbology tab (for
'quantities') click 'symbol' column heading and then
- ArcMap tips
- Lab #4 notes
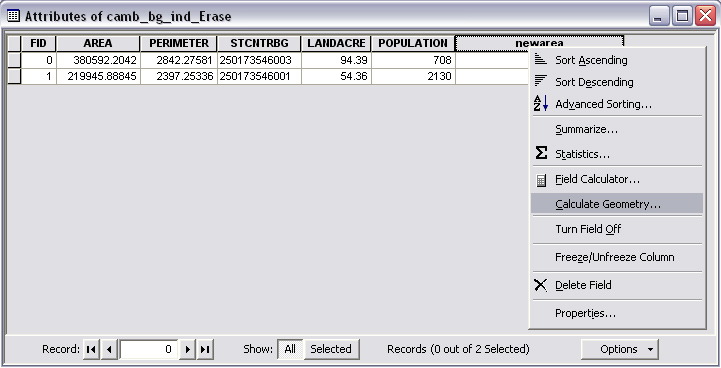
- Exporting tables and shapefiles
- Use ArcCatalog to move GIS files in C:\temp to your I: locker before you logout! (You can use Windows Explorer to safely move MS-Access databases, text files, and entire folders.)
- MS-Access tips and tricks:
- You can switch (via menus and right-click short cuts) between 'views' of a query: design view, SQL view, and datasheet view (i.e., the table)
- Before 'exporting' a table from one MS-Access database into another MS-Access database, you must first create an empty database to receive the table (or you can export it to a personal geodatabase, which uses the *.mdb format)
- ArcMap reads MS-Access databases in the older 2002-2003 (*.mdb) format not the newer 2007+ (*.accdb) format
Major
Topic: Spatial Analysis (using Vector-based Data Models)
- Taking advantage of GIS to handle spatial
operations
- Do vector-based spatial analysis today
- Do raster-based spatial analysis next Wednesday
- Do 'model builder' right after Break.
- Then web mapping, field data collection, and mapping API access using R
- That's all we have time for in lectures and lab exercises (some terrain analysis and 3D modeling at end)
- Rest of second-half (11.520) is the individual project
- For project: start thinking about topic of interest, spatial component, and possible data source
- Spatial 'Join' issues:
- Combine data from different sources based on location & proximity
- Present results so that they can by visualized and/or encoded and saved for further use
-
Examples of spatial 'joins' - we have already seen some of the tools for these examples
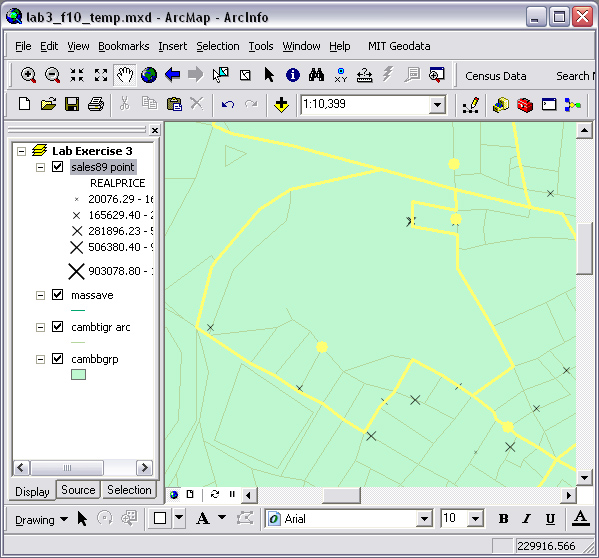
Which Cambridge house sales fall within which census blockgroups - Point-in-polygon operation
- Because we want to know about the neighborhood surrounding lower-price homes...
- Can we add census data to the sales attribute table? (not just 'select' the census block group containing the sale)
Which blockgroups are in which Mass Town? - Polygon-in-polygon operation
- Tricky because polygon boundaries may not line up (sliver & gap issues)
- How do we create a cross-reference table (for blockgroups and towns)
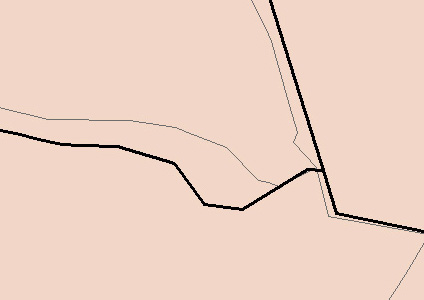
Which roads are in the flood plain? - Line-in-polygon operation
- Should you cut up the road segments or list line segments with part (>50%) inside?
- What happens to attributes of split road segments (keep names, divide length,...)
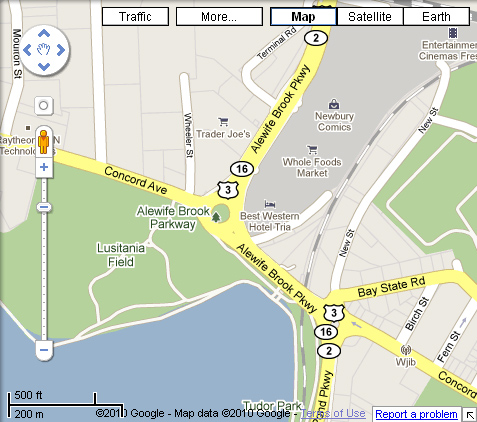
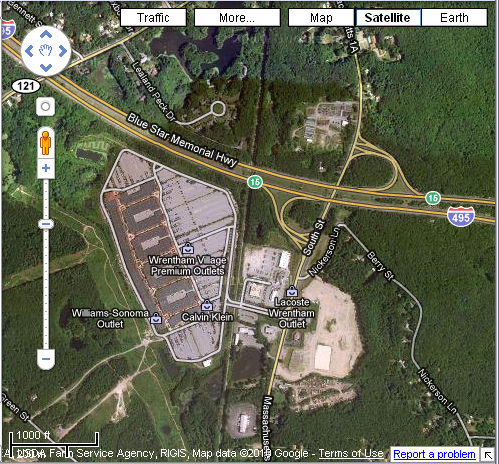
Which shopping centers are close to major highways - How do we represent shopping centers (point or polygon)
- How do we represent highways? (line, polygon, or just the exits)
- Where is this exit? (the perimeter of the Wrenthan outlet mall is > 1 mile)
-
There are many interesting Proximity questions
- ...and, we now have the background to utilize much of ArcToolbox on our own
General spatial operations
-
Equals – are the geometries the same?
-
Disjoint – do the geometries share at least a common point?
-
Dissolve – Eliminate boundaries with same attribute value on each side.
-
Intersect – Create all the combined pieces when features are overlaid
-
Touch – do the geometries intersect at their boundaries?
Buffering Vector Data
-
Buffering creates new polygon features by computing which areas are within a certain specified distance of the selected object.
-
Buffering may define a new spatial object whose boundary enclosed all the area within the buffer
-
the geometric computations can be complex
- beware of islands, slivers, etc.
- involves choices when buffers of selected features overlap (dissolve...)
-
-
Buffer Input: Points, lines or polygons.
-
Buffer Output: Polygon(s).
Buffering Raster Data
-
Classify grid cells according to whether they lie inside or outside the buffer.
-
In addition to distance, you can also use any function of grid cell values (e.g. travel speed) as a buffer criteria.
-
The result is a new table of cell values for each grid cell - e.g., a raster map distinguishing all grid cells with, say, less than 30 minutes travel time from a particular point (e.g., a city center).
- More on raster modeling and analysis after next Monday's vector analysis lab.
Point in Polygon
-
Whether a point lies inside or outside a polygon.
- In the case of many points and many polygons, the task is to assign points to polygons
-
Common operation:
-
Many mailing lists and GPS readings are 'geocoded' into point files
-
You need point-in-polygon operation to tag the attributes of the point map layer with characteristics of the places they are 'in'
- Sometimes, point-in-polygon is used to
handle difficult polygon-on-polygon operations such as the
blockgroup-in-town issue in HW#2
- Variations along boundaries create slivers and make polygon-on-polygon overlay unsatisfactory
- Compute centroids of blockgroups first, or extend one boundary with a small buffer and then intersect, ...
- Illustrate point-in-polygon operations using blockgroup centroids to see which ones fall inside which towns
- ArcGIS operation
- Find the right tool in ArcToolbox (use the 'search' tab if necessary)
- Use 'spatial join' operation in order to add polygon attribute information to the point attribute table
- We have seen this join-by-spatial-location operation when doing join-by-attribute operations
- This operation - and many others - can be accessed from ArcToolbox (under the 'analysis tools' menu)
-
Line in Polygon
-
Used to determine whether a line lies inside or outside a polygon.
-
In the case of many lines and many polygons, the task is to assign line segments to polygons.
-
ArcGIS operation:
- Intersect lines and polygons in order to tag attributes of line segments with polygon information
- Since polygons aren't likely to cross all lines precisely at the ends of the line segments, this operation can be complex since the operation must split lines at the polygon boundaries and assign the appropriate attributes to each new segment.
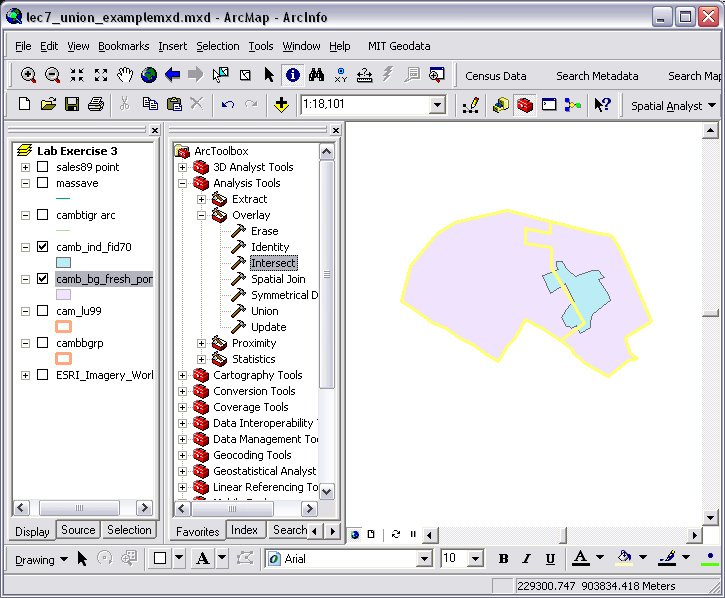
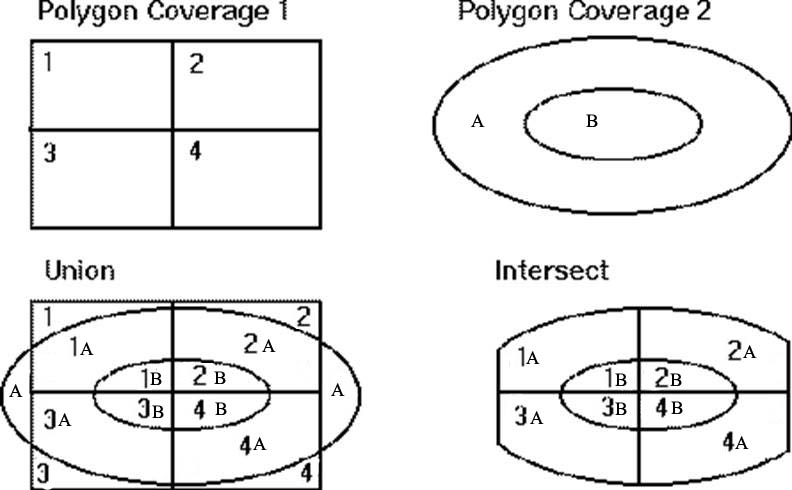
Polygon Overlay
-
Many possible ways of intersecting polygons with one another
-
Intersection: Polygon 1 + polygon 2 = polygon 3 (with common areas)
-
Union: Polygon 1 + polygon 2 = polygon 3 (with both areas)
-
- Many issues about how to interpret the results
- Handling slivers due to geometric errors or differences in degree of generalization of boundaries
- Handling attributes
- Some attributes apply to each fragment without change (e.g., in flood plain, in city...)
- Some attributes need to be 'allocated' to each fragment (e.g., population in each part of blockgroup)
- In next Monday's lab exercise we will have examples (e.g.,
estimate number of people living within a specified distance
of MIT's biology building)
- We will do an 'area allocation' to find the fraction of area in a block group that is inside the buffer and use that fraction to estimate the population living inside the buffer
More
spatial data processing
- Dissolve features based on an attribute.
- Merge layers together
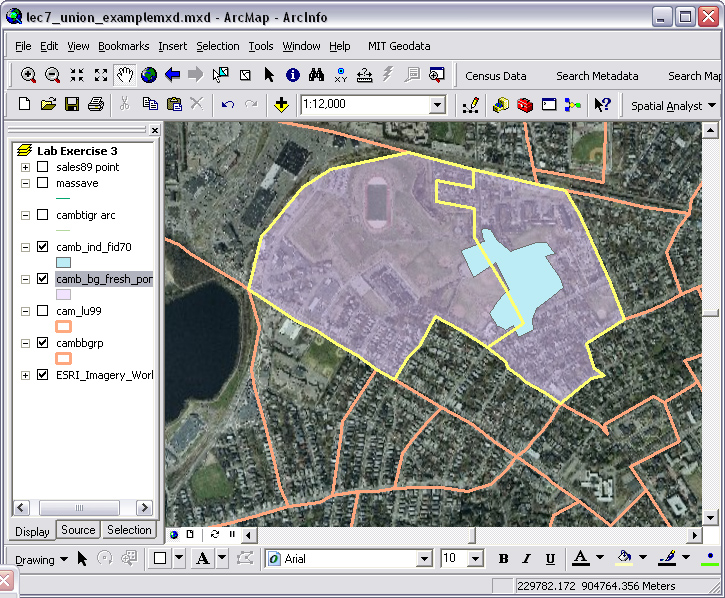
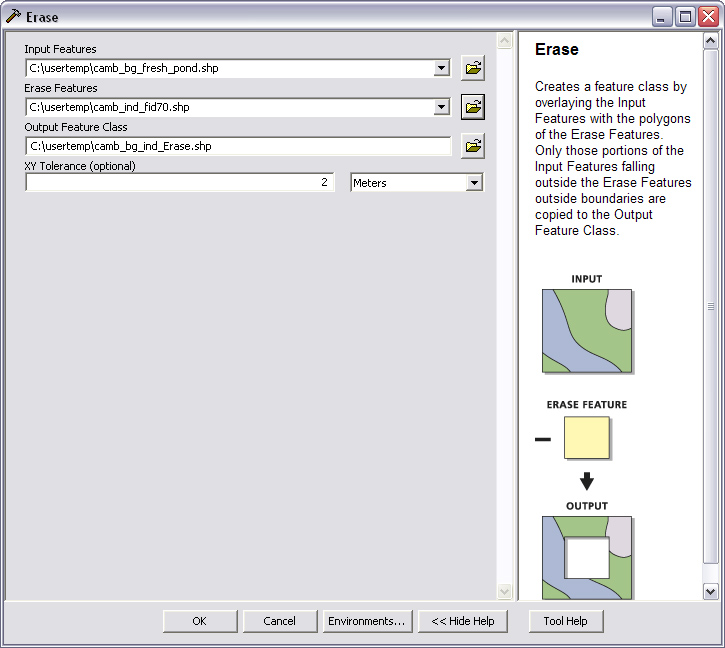
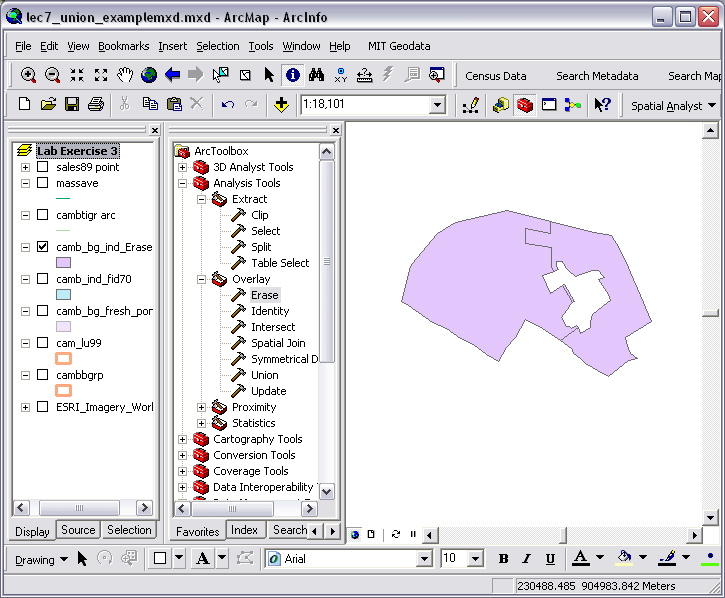
- Clip one layer based on
another (including 'erase' as well as 'cutout')
Spatial
Analysis Example - Locating a Shopping Center
- Criteria for 'good' location:
- Within two miles of a major highway, but no less than one quarter mile away from a major highway.
- At least one mile away from a water body (e.g., rivers, lakes).
- Not in the flood zone.
- Close to a major residential area (at least 2500 households within 5 miles).
- On a large enough piece of vacant land (at least 10 acres)
Data
Required
- Highway layer (linear feature),
- Vacant land layer (polygon feature),
- Rivers layer (linear or polygon feature),
- Lakes layer (polygon feature),
- Land use layer (polygon feature),
- Flood zone layer (polygon feature),
- Census layer (blockgroup
level, polygon feature).
Spatial
Analysis Process
- Select vacant land parcels larger than 10 acres, result: vacantlg10.
- Buffer
highway layer with 2 mile and .25 mile buffers, result: hw2
and hwquarter.
- Intersect vacantlg10 with hw2 = vacanthw1, useful land.
- Union hwquarter with river1, lake1 and flood (need to do two layers at a time), result: notusable, (land not meeting the criteria)
- Remove notusable from vacanthw1, result: usable.
- Intersect usable with census blockgroup layer (touch the boundary of), result: usableblock.
- Calculate and reselect usableblock
having the total number households larger than 2500,
result: bigusableblock.
Additional
criterion
- Add socio-economic criteria: “The median household income of the proximate residential area should be less than $30,000”?
- Refine 'major residential area' criterion
- Require enough people within a buffer area around site
- Require
proximity to dense residential
area