This lab exercise will introduce you to ArcView's ability to perform network analyses involving line coverages such as the Cambridge TIGER file. Any system of interconnected linear features (e.g., roads, railways, rivers, pipelines, telephone lines) is a network. Networks can be helpful if you want to analyze the movement of people, the transportation of goods or the flow of energy along these networks. A common goal of network analysis is to determine the most efficient connections between points, for example the quickest way of getting home from school. The problem solving gets more complex when you want to determine the most efficient way of delivering goods to stores nationwide.The ArcView online help describes ArcView's Network Analyst extension as a tool that "can solve common network problems on any theme containing lines that connect. This theme can be a shapefile, an ARC/INFO coverage, or a CAD drawing. Before solving a problem, you can model networks and add constraints, including setting up average travel times, one-way streets, prohibited turns, overpasses and underpasses, and closed streets." According to the help file, the Network Analyst can help you
First you must add the Network Analyst extension to your project.
To prepare your coverages for networking, do the following:
Now you are ready to use the Network Analyst.
You have just finished a long stretch of exams and the weather is unseasonably warm and sunny. You and your friends decide to explore Cambridge and go for ice cream at Christinas Homemade Ice Cream Shop. You decide to use your newly acquired GIS skills to help you find the shortest connection to go from MIT (77 Massachusetts Avenue) to Christinas..Make sure that the Cambtigr coverage is the active theme (highlight it in the view's table of contents). From the 'Network' menu item, select 'Find Best Route...'. This opens up a "problem definition" window like that shown below.
It also adds a Route# theme to your view, which will eventually display your analysis results. The Network Analyst in ArcView lets you select locations in two ways:
To locate '77 Massachusetts Ave' we will use the second method. From the 'Network' menu, choose 'Add Location by Address' or click on the third button from the left in the first button bar. A window prompts you for an address. Type in '77 Massachusetts Ave' without the quotes. A marker for this location should appear. (Note that address matching is spelling sensitive. For example, '77 Mass Ave' would not be found). For Christinas Ice Cream Shop we can select this record from the ice cream shop theme and select the load stops option from the 'Find the Best Route...' window. Once you select the ice cream shop theme ArcView will look for selected records from that theme and Label Christinas' Stop #2. If you get the message -
1 out of 1 points just loaded are not on or near the network. Do you want to keep them?
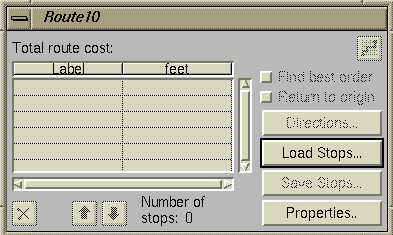
Say yes and then repeat the Load Stops command and reload the destination stop. Once you have determined your origin and destination this way, solve the problem by selecting the 'Solve Problem' item from the 'Network' menu or by clicking on the problem- solving button
.
You should see something similar to this window.
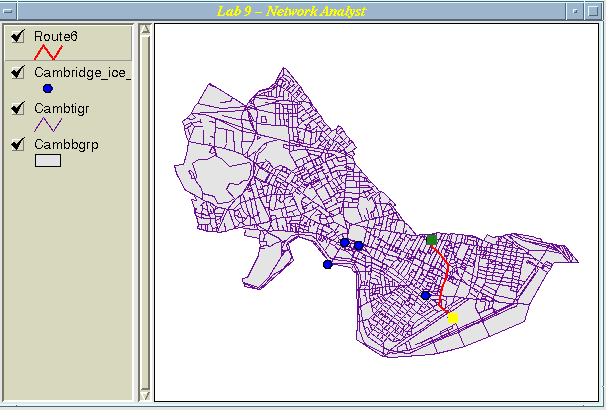
Take a look at the directions that are automatically generated by clicking on the appropriate button in the problem definition window.
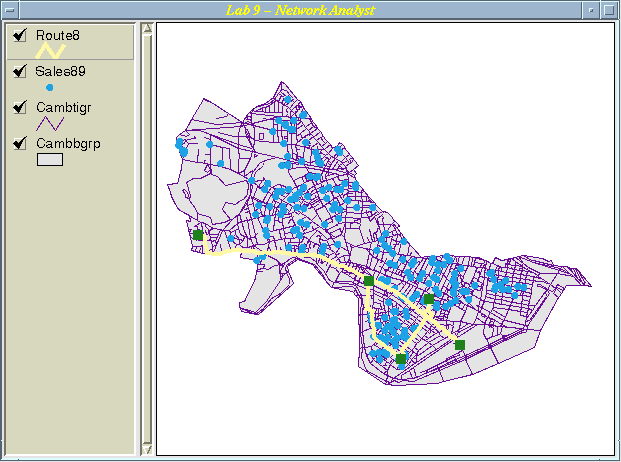
Now you want to visit all homes that sold in Cambridge in 1989 for under $50,000. This time, instead of typing addresses, select locations based on their actual price NOT their real price, using the Sales89 theme as a guide. First, make the Cambtigr theme active before invoking the Network Analyst. Then select 'Find Best Route' from the 'Network' menu again. A new Route# coverage is added to your view. Use 'Add Location by Address' to specify '77 Massachusetts Ave' as your starting point. Use 'Load Stops' to add the select Sales89 records to your route. Finally, you notice that three of the selected sales are relatively close to one another so you decide to select one additional location near those by cursor. Make sure you activate the new Route theme, then click on the 'Specify a network location by cursor button' button on the second row of buttons; it looks like this:. Your cursor should now have a little flag attached to it. Once you have selected an additional location, select the 'Find best order' option in the problem definition window and click on the 'Solve Problem' button. Your map should look much like the one below. However, you should have an additional housing sale included in your route.
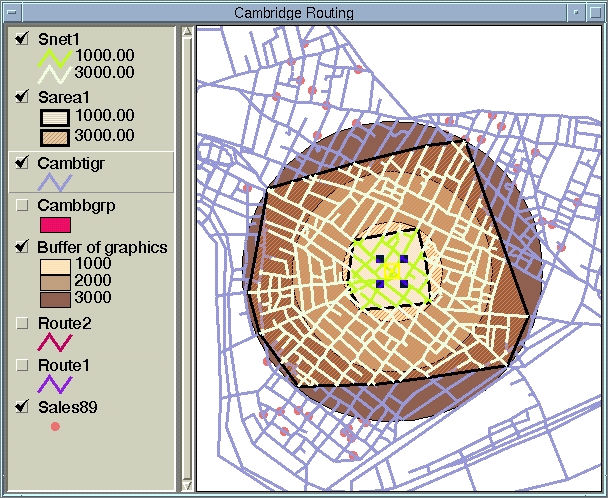
Now let's suppose that you want to find out the neighborhood characteristics of Central Square. For this task, you need the census data in Cambbgrp. Add the Cambbgrp coverage to your view.Select 'Find Service Area' from the 'Network' menu item (make sure that the Cambtigr theme is active). Two new themes are added (Snet# and Sarea#). Locate Central Square using the address '670 Massachusetts Ave'. In the Network Analyst problem definition window, double click in the cell of the first entry in the 'Feet' column (if you don't see the Feet column, slide the table bar over to the right) and enter '1000, 3000' (without quotes), which means that you are interested in all streets that are within a 1000/3000 feet distance of Central Square. Then solve the problem. Your view should now resemble the image below.
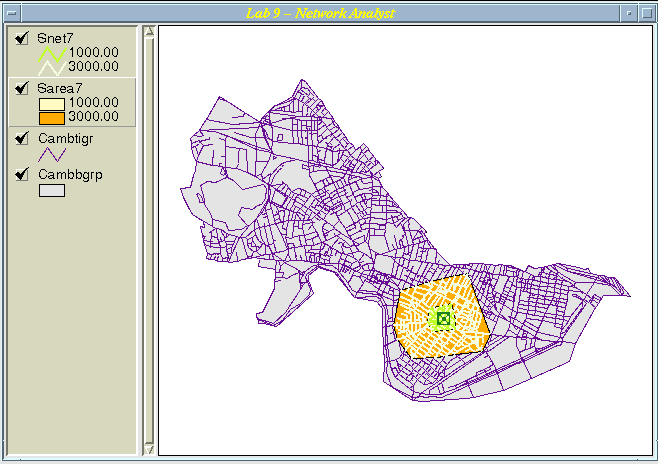
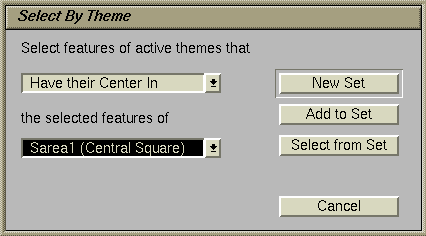
The Snet# theme represents the streets within 1000 and 3000 feet of Central Square as measured by following the street links. The distance calculated this way can be quite different from the Euclidean-distance buffers we have used before, which measured the distance "as the crow flies." The Sarea# theme is a network buffer around the point you selected. It is built from the Snet# theme by connecting the points on the street links at the specified distances to form polygons.We are interested in the neighborhood characteristics of all the block groups that intersect with the selected area. Highlight Cambbgrp in the view's table of contents and then choose 'Select by Theme' from the 'Theme' menu item. This lets you select features from the active theme based on a condition that relates to another theme. You want to select all block groups that have their center within the specified radius. Choose 'Have their Center in' and the Sarea# coverage for the criteria features. Then click 'New Set'.
To find out more information about the block group characteristics of the selected blockgroups, open the attribute table for Cambbgrp. For example, highlight the Median Rent column and take a look at the summary statistics. You should get a mean median rent of $527.The statistics you have calculated are for the block groups that have their center within the 3000-foot distance. Now you want to know the median rent of the block groups that have their center within the 1000-foot distance only. Make the Sarea# theme active and click on the 'Select Feature' button (fourth button from the left on the second button bar:
), then click on the inner radius to select that area. Make the Cambbgrp theme active and follow the instructions above (using the 'Select by Theme' menu item under 'Theme') to see the summary statistics for the selected block groups. Two block groups should be selected. Arrange your themes to see the highlighted block groups under the Sarea# theme. This time, you should get a mean median rent of $441.
Let's compare the network buffers we have been using in this exercise with the Euclidean-distance buffers we have made previously. Make sure that the marker indicating Central Square is visible. If it is not, make sure the Snet# theme you created is turned on. Select the graphics selection tool (the plain arrow on the lower toolbar, just to the right of the 'i' tool). Click once on the marker to select it. Four squares will appear around it if you have done this correctly.Now select the 'Create Buffers' item from the 'Theme' menu. In the dialog box that appears, specify that you want to buffer the graphics in your view and that you want to use only the selected graphics; these should be the defaults. Then click the 'Next >>' button.
In the second dialog box, specify that you want to create multiple rings: 3 rings, 1000 feet apart. This choice is not the default. Click on the 'Next >>' button.
In the final dialog box, indicate that you want to dissolve the barriers between buffers (the default) and that you want to save the buffers in a new theme saved in your 11.520 user directory (not the default). Click the 'Finish' button, and look for the "Buffer of graphics" theme to appear.
Experiment with the various theme properties of the layers you are now displaying to help you effectively see the differences among the themes. You may find it useful to use a fill pattern of a pattern of dots or lines with a transparent background color to allow you to "see through" a polygon layer to the layers underneath. You may have to try a variety of options until you get a result you are satisfied with. Your final result might resemble the screen below.
Note: Your assignment for lab 9 includes some of the queries done in class as well as a couple that you should complete on your own now that you are an ArcView Network Analyst expert. Have a happy Turkey Day!!