Massachusetts Institute of Technology - Department of Urban Studies and Planning

11.520: A Workshop on Geographic Information Systems
11.188: Urban Planning and Social Science Laboratory
 

Lecture 7: Spatial Analysis (Vector Models)


October 13, 2010

(Joseph Ferreira, Jr., based, in part, on notes by Visting Prof. Zhong-Rhen Peng from Fall 2003)


Administrative Notes:

  • Feedback and Comments
    • MS-Access tips and tricks:
      • When opening: security warning - unsafe expressions not blocked
        • Say 'no' for trusted databases; 'yes' still works if database is pure data (but resets default behavior)
        • "This file may not be safe..." - must click 'open' in order to access the database
      • You can switch (via menus and right-click short cuts) between 'views' of a query: design view, SQL view, and datasheet view (i.e., the table)
      • Before 'exporting' a table from one MS-Access database into another MS-Access database, you must first create an empty database to receive the table
    • ArcMap tips
      • In 'layer properties' symbology tab (for 'quantities') click 'symbol' column heading and then
        • choose 'flip colors' to switch ordering of colors
        • choose 'properties for all symbols' to adjust fill or outline colors for all categories
    • Lab #5 notes
      • Exporting tables and shapefiles
        • C:\usertemp is in fact a local drive. Beware that your locker (drive I:) and other parts of drive C: (such as the Desktop) are actually network drives (on drive H: or drive I:)
        • Use ArcCatalog to move GIS files in C:\usertemp to your I: locker before you logout! (You can use Windows Explorer to safely move MS-Access databases and text files.)
      • The 5053 block group count for Mass - the count will be a little lower (around 5030) after you exclude the block groups that have no workers (and lower yet for Eastern Mass)
  • Homework Schedule
    • HW#1 due today!
    • HW#2, Part I due next Wednesday (Oct. 20) - census data queries for 5 towns in Cambridge neighborhood
      • All of homework #2 is expected to take 15-20 hours (over 4 weeks) - Part II is longer than Part I
    • HW#2, Part II due two weeks later (Nov. 3) - site suitability analysis for Senior Center
    • HW#3, Part I due the following week (Nov. 10) - add a raster layer to the HW#2 site suitability analysis
    • HW#3, Part II due on Monday before Thanksgiving (Nov. 22) - use Model Builder to automate your raster analysis
  • Lab Schedule
    • Lab #5 due Monday, Oct. 18 - census data
    • Lab #6 due one week from Monday, Oct. 25 - Vector Spatial Analysis (count kids close to MIT Bio building)
    • Lab #7 due following Monday, Nov. 1 - Raster Spatial Analysis and Model Builder
    • Lab #8 due Wednesday, Nov. 17 - Web Mapping and Shapefile Creation
  • Test in Lab (hands-on, open book) on Monday, Nov. 15
  • Project Schedule
    • Mini-proposal (title+one-paragraph) due by Wednesday, Nov. 17
    • Project Title plus Abstract due by Nov. 29
    • Project presentation on Monday, Dec. 6, and Wednesday, Dec. 8
    • Project writeup due by Dec. 8 but okay by Dec. 13


Major Topic: Spatial Analysis (using Vector-based Data Models)

  • Taking advantage of GIS to handle spatial operations
    • Do vector-based spatial analysis today
    • Do raster-based spatial analysis next Wednesday
    • Do web mapping the next week
    • Do 'model builder' after that.
    • That's all we have time for in lectures and lab exercises (some terrain analysis and 3D modeling at end)
    • Rest of semester is an in-lab test (Nov. 15) and individual project
  • Spatial 'Join' issues:
    • Combine data from different sources based on location & proximity
    • Present results so that they can by visualized and/or encoded and saved for further use


  • Examples of spatial 'joins' - we have already seen some of the tools for these examples
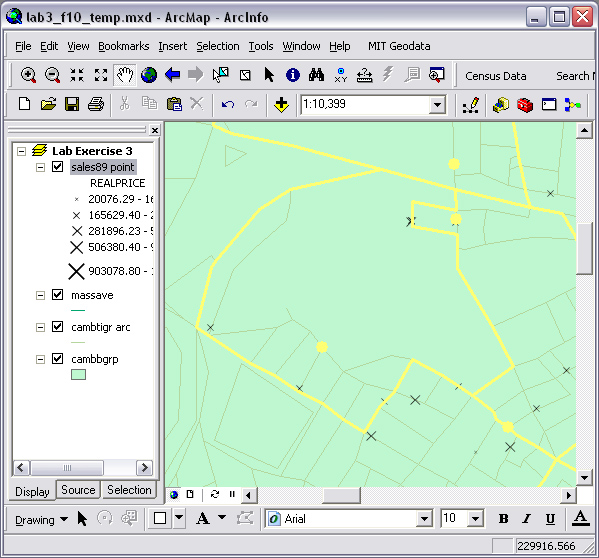
    Which Cambridge house sales fall within which census blockgroups
    • Point-in-polygon operation
    • Because we want to know about the neighborhood surrounding lower-price homes...
    • Can we add census data to the sales attribute table? (not just 'select')
    point-in-polygon example
    Which blockgroups are in which Mass Town?
    • Polygon-in-polygon operation
    • Tricky because polygon boundaries may not line up (sliver & gap issues)
    • How do we create a cross-reference table (for blockgroups and towns)
    sliver-problem-example
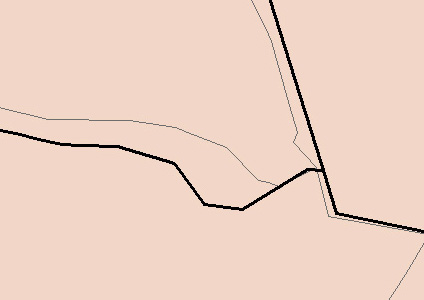
    Which roads are in the flood plain?
    • Line-in-polygon operation
    • Should you cut up the road segments or list line segments with part (>50%) inside?
    • What happens to attributes of split road segments (keep names, divide length,...)
    fresh-pond-mall-example
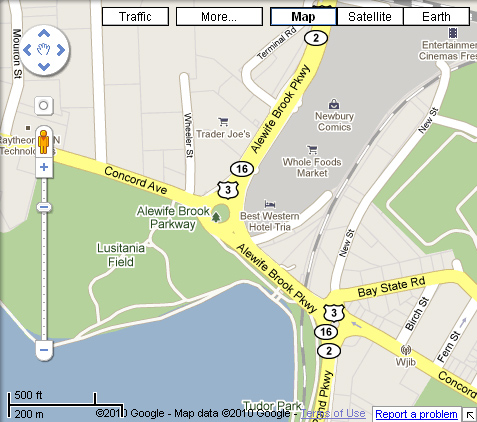
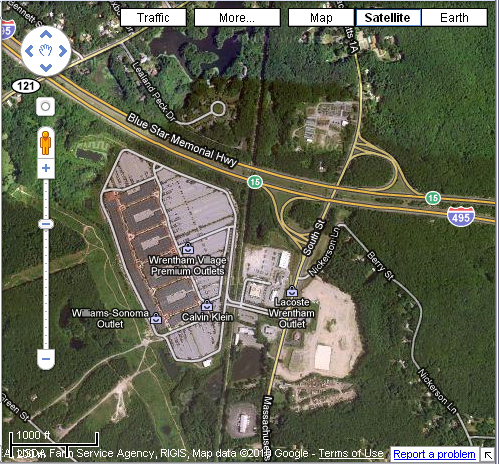
    Which shopping centers are close to major highways
    • How do we represent shopping centers (point or polygon)
    • How do we represent highways? (line, polygon, or just the exits)
    • Where is this exit? (the perimeter of the Wrenthan outlet mall is > 1 mile)
    wrentham-outlet-mall-example

  • There are many interesting Proximity questions
    • ...and, we now have the background to utilize much of ArcToolbox on our own


General spatial operations

  • Equals – are the geometries the same?
  • Disjoint – do the geometries share at least a common point?
  • Dissolve – Eliminate boundaries with same attribute value on each side.
  • Intersect – Create all the combined pieces when features are overlaid
  • Touch – do the geometries intersect at their boundaries?

Buffering Vector Data

  • Buffering creates new polygon features by computing which areas are within a certain specified distance of the selected object.
  • Buffering may define a new spatial object whose boundary enclosed all the area within the buffer
    • the geometric computations can be complex
    • beware of islands, slivers, etc.
    • involves choices when buffers of selected features overlap (dissolve...)
  • Buffer Input: Points, lines or polygons.
  • Buffer Output: Polygon(s).


Buffering Raster Data

  • Classify grid cells according to whether they lie inside or outside the buffer.
  • In addition to distance, you can also use any function of grid cell values (e.g. travel speed) as a buffer criteria.
  • The result is a new table of cell values for each grid cell - e.g., a raster map distinguishing all grid cells with, say, less than 30 minutes travel time from a particular point (e.g., a city center).
  • More on raster modeling and analysis after next Monday's vector analysis lab.


Point in Polygon

  • Whether a point lies inside or outside a polygon.
  • In the case of many points and many polygons, the task is to assign points to polygons
  • Common operation:
    • Many mailing lists and GPS readings are 'geocoded' into point files
    • You need point-in-polygon operation to tag the attributes of the point map layer with characteristics of the places they are 'in'
    • Sometimes, point-in-polygon is used to handle difficult polygon-on-polygon operations such as the blockgroup-in-town issue in HW#2
      • Variations along boundaries create slivers and make polygon-on-polygon overlay unsatisfactory
      • Compute centroids of blockgroups
      • Do point-in-polygon operations to see which blockgroup centroids fall inside which towns
    • ArcGIS operation
      • Find the right tool in ArcToolbox (use the 'search' tab if necessary)
      • Use 'spatial join' operation in order to add polygon attribute information to the point attribute table
      • We have seen this join-by-spatial-location operation when doing join-by-attribute operations
      • This operation - and many others - can be accessed from ArcToolbox (under the 'analysis tools' menu)
      • 'Desktop' ArcGIS tools have less sophisticated capabilities than 'workstation' and 'arcedit' tools (that cost additional money for the extra tools in ArcToolbox)

Line in Polygon

  • Used to determine whether a line lies inside or outside a polygon.
  • In the case of many lines and many polygons, the task is to assign line segments to polygons.
  • ArcGIS operation:
    • Intersect lines and polygons in order to tag attributes of line segments with polygon information
    • Since polygons aren't likely to cross all lines precisely at the ends of the line segments, this operation can be complex since the operation must split lines at the polygon boundaries and assign the appropriate attributes to each new segment.

Polygon Overlay

  • Many possible ways of intersecting polygons with one another
    • Intersection: Polygon 1 + polygon 2 = polygon 3 (with common areas)
    • Union: Polygon 1 + polygon 2 = polygon 3 (with both areas)
  • Many issues about how to interpret the results
    • Handling slivers due to geometric errors or differences in degree of generalization of boundaries
    • Handling attributes
      • Some attributes apply to each fragment without change (e.g., in flood plain, in city...)
      • Some attributes need to be 'allocated' to each fragment (e.g., population in each part of blockgroup)
    • In next Monday's lab exercise we will have examples (e.g., estimate number of people living within a specified distance of MIT's biology building)
      • We will do an 'area allocation' to find the fraction of area in a block group that is inside the buffer and use that fraction to estimate the population living inside the buffer


More spatial data processing

n       Dissolve features based on an attribute.

n       Merge layers together.

n       Clip one layer based on another.


Spatial Analysis Example - Locating a Shopping Center


n       Criteria for 'good' location: 

n        Within two miles of a major highway, but no less than one quarter mile away from a major highway.

n        At least one mile away from a water body (e.g., rivers, lakes).

n        Not in the flood zone.

n        Close to a major residential area (at least 2500 households within 5 miles).

n        Requires a large piece of vacant land (at least 10 acres)

n      Classic 'site suitability' analysis

n      Decompose task into many ArcGIS analysis steps

Data Required

n       Highway layer (linear feature),

n       Vacant land layer (polygon feature),

n       Rivers layer (linear or polygon feature),

n       Lakes layer (polygon feature),

n       Land use layer (polygon feature),

n       Flood zone layer (polygon feature),

n       Census layer (blockgroup level, polygon feature).


Spatial Analysis Process

1.    Select vacant land parcels larger than 10 acres, result: vacantlg10.

2.    Buffer highway layer with 2 mile and .25 mile buffers, result: hw2 and hwquarter.

3.    Buffer Rivers and Lakes layers with 1 mile buffers, result: river1 and lake1.

4.    Intersect vacantlg10 with hw2 = vacanthw1, useful land.

5.    Union hwquarter with river1, lake1 and flood (need to do two layers at a time), result: notusable, (land not meeting the criteria)

6.    remove notusable from vacanthw1, result: usable.

7.    intersect usable with census blockgroup layer (touch the boundary of), result: usableblock.

8.    calculate and reselect usableblock having the total number households larger than 2500, result: bigusableblock.


Additional criterion

n       Consider an additional criterion: “The median household income of the proximate residential area should be more than $30,000”?

n       Refine 'major residential area' criterion

    • Require enough people within a buffer area around site
    • Require proximity to dense residential area


ArcGIS Example of 'UNION' Operator:

Cut out the industrial area from two block groups near Sherman and Walden St. in Cambridge (near Fresh Pond)

Cambridge block groups: STCNTRBG = 250173546003 and 250173546001
with Industrial land use (code=16) overlaid across Sherman St.

cambridge-industry-overlay-example
Choose the CLIP extract tool in ArcToolbox
cambridge-industry-intersect
Use the industrial land use boundaries to erase the industrial parts of the two block groups
camb-erase-window
End up with the industrial area cut out from the two block groups
cambridge-after-erase
BEWARE: all attribute values are retained in attribute table - even if no longer correct (e.g., area, perimeter, and landacre). You can recalculate area and perimeter, but the change in landacre is unknown. (Do you understand this?)
cambridge-add-newarea
cambridge-area-calc

cambridge-newarea-calc2

Note that the new area of the block groups is reduced by the erased area.


ArcGIS Example of 'polygon-in-polygon' operation

(to find which blockgroups are in which town for your use in Homework #2)

  • Here are the steps we used to produce the Town/Blockgroup cross reference table (so the homework would be easier and you would not have to figure out all these steps):
    • A 'Spatial Join' involving polygon-to-polygon operations will have problems
      • It results in many 'sliver' issues along the edges of the blockgroups and town boundaries
    • Instead, compute centroid of blockgroups and then do a point-in-polygon operation to find all the blockgroups in Cambridge and the surrounding towns
      • Recent versions of ArcGIS can do this more easily by:
        1. Using the 'centroid within' choice when doing a 'spatial join' polygon-on-polygon operation, or
        2. Using the 'calculate geometry' options in the 'field caculator' to add fields with the XY centroid values
      • We will do it the 'long way' to demonstrate the use of visual basic scripts (VBA) to grab data from the in-memory ArcMap geometry and save the valued in attribute columns of shapefile layers

  • How can we compute (and save) centroid XY values ?
    • Centroids are interior points 'close' to the 'middle' of a polygon
      • What should be the centroid of a C-shaped polygon?
      • How can you tell if a point is 'inside' of a polygon?
    • Centroids are NOT part of 'shapefile' data model - which only stores boundaries
    • BUT, they are already computed and available in the runtime ArcMap data model
    • Use ArcGIS help to find a way: look up 'Centroid - calculating coordinates' in ArcGIS help
      • First, simplify the task by selecting the blockgroups in the 5-town area around Cambridge
        • Select blockgroups in and around the 5 towns and save to a new shapefile (blkgrp_start.shp)
        • add empty fields (called X and Y) to the attribute table of blkgrp_start (as double precision numbers)
      • Strategy: use VBA script to pull centroid X,Y data from the ArcMap data model into the XY fields of the attribute table
        • Read 'about making field calculations' and, in particular, the 'Performing calculations on feature geometry' and 'Common VBA functions in the Field Calculator' sections
        • Calculate new X values using the 'advanced' button and this VBA script:

          Dim dblX As Double
          Dim pArea As IArea
          Set pArea = [Shape]
          dblX = pArea.Centroid.X

        • Repeat for Y and export the edited table - call it blkgrp_c.dbf
    • Add blkgrp_c to the data frame and create a new point shapefile 'blkgrp_c_Events' of the XY centroids
      • Use Tools/Add-X-Y-data option
    • Finally, Use the point-in-polygon spatial join operation to attach town attribute information to the point attribute table 'blkgrp_c_Events'.
      • Right-click on the 'blkgrp_c Events' layer and choose the 'join' option from the 'joins & relates' menu item,
      • Instead of joining attributes based on relating two tables, we want to 'join data from another layer based on spatial location'
      • The layer we want to join to the selected layer (blkgrp_c Events) is the town layer (which we called cambridge5 when we saved the 5-town boundaries above),
      • This operation will add the columns in the cambridge5 attribute table to the columns in the 'blkgrp_c Events' attribute table where the rows are matched based on the town that contains each block group centroid. The results are stored in a new shapefile with the same block group centroid points and the expanded attribute table.
      • You won't be able to do the spatial join unless each of the layers you are joining have a known spatial reference system - because the spatial join won't be meaningfull unless both layers can have all their coordinate expressed (or transformed) into the same coordinate system.
      • This expanded attribute table has the blk_key in one column and, now, the town name and code in another column. So, we turned off all the columns except for blk_key and Town and and selected only those blockgroups in the 5 towns. Exporting this table produced the block-group-to-town (blkgrp2t.dbf) lookup table that we have included in the 11.520 data locker for your use in HW#2.

    • Note 1: For ArcGIS v. 9.3 (or later), there is a 'calculate geometry' as well as 'field calculator' option in the attribute table tools so it is easier to calculate area, perimeter, or centroid location via 'calculate geometry' rather than writing VBA script in the 'field calculator'
    • Note 2: For ArcGIS v. 9.3 (or later), the 'select by location' operation provides a 'centroid within' option so you can select all the blockgroups with their centroid in a particular town without having to separately calculate centroids. But you would have to do the selection for each town, add the town name, and combine the results into a single table.


Homework #2: This will take some time! Spread out the work!

  • start early, focus on spatial operations for suitability analysis
  • save often, take care in naming intermediate files, save several *.mxd project files early and often - with different version numbers as you move along.
  • expect to redo overlays a few times before you like result (so you need to remember the saved pieces and combine them into new projects)


Last modified 11 October 2010 [jf]
Back to the CRON Home Page. Back to the 11.520 Home Page.