Review a few points from last lecture
- Using OGC-complaint web mapping services (i.e., WMS servers)
- ArcGIS version 9.2 has trouble with WMS servers such as at MassGIS - ArcGIS version 9.3 is better but not in the lab.
- Illustrate ArcGIS version 9.3 - specify version 1.1.1 in Add WMS Service dialog box
- Try with "Political / Administrative Boundaries"
- ArcGIS 9.3 still will render MassGIS WMS services only if Data Frame is set to lat/lon (WGS84)
- Getting parameters to match required version, coordinate system, and bounding box (as well as layer) can be frustrating - in fact, much more frustrating than we had intended!
- WMS servers *are* worthwhile for constantly changing layers or for gigantic layers (like imagery) that do not change and are maintained by someone else (and displayable in many different ways depending upon style, coordinates, etc.)
- Part of the problem is that MassGIS and many clients now support multiple WMS protocol versions
- Illustrate ArcGIS version 9.3 - specify version 1.1.1 in Add WMS Service dialog box
This URL (from last lecture and similar to those in lab exercise #8) does not specify WMS version level:
==> NOTE version information in error message reply:http://maps.massgis.state.ma.us/mapaccess/main.jsp?dpi=120&request=GetMap&layers=MHD+Roads&styles=Class&srs=EPSG:26986&bbox=233500,900000,236500,902500&width=640&height=480&format=image/png&service=wms Error message returned by above URL when used as address in ordinary browser:
<ServiceExceptionReport version="1.2.0">
<ServiceException> Either the server is down or the request cannot be processed by the server: MHD Roads
</ServiceException>
</ServiceExceptionReport>Adding "version=1.1.1" to parameters in the same URL now works: (the images are similar to the street map overlays shown in the next section) http://maps.massgis.state.ma.us/mapaccess/main.jsp?version=1.1.1&dpi=120&request=GetMap&layers=MHD+Roads&styles=Class&srs=EPSG:26986&bbox=233500,900000,236500,902500&width=640&height=480&format=image/png&service=wms - Illustrate use in Google Earth - Illustrate once again and add some new features
- Recall URL that overlays streets and street names using the MassGIS services: (Try this URL in a browser): Image A:
- We can put (almost) the same URL into Google Earth in order to overlay street names when we are looking at Massachusetts areas
- Add &transparent=true at end of URL so WMS map image is transparent (except for streets and street names)
- Change EPSG (coordinate system ID) to 4326 (WGS84, lat/lon coordinates)
- Change the orginal bounding box to be appropriate lat/lon: &bbox=-71.1,42.35,-71.0,42.37
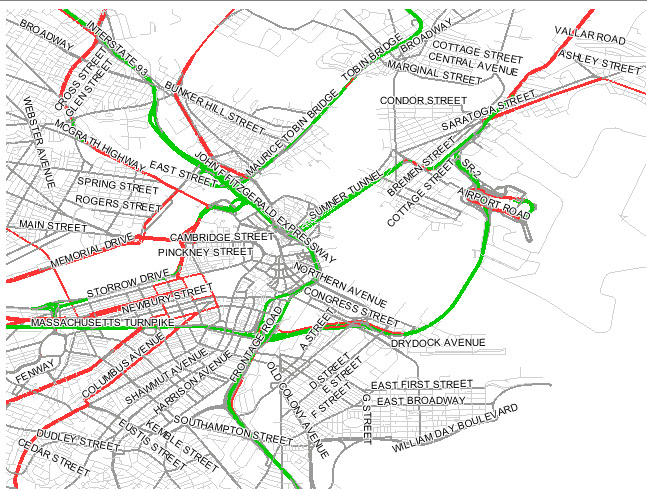
- The resulting URL is: Image B: (I have also added the version specification for added assurance)
- http://maps.massgis.state.ma.us/mapaccess/main.jsp?version=1.1.1&dpi=120&request=GetMap&layers=MHD+Roads&styles=Class&srs=EPSG:4326&bbox=-71.1,42.35,-71.0,42.37&width=640&height=480&format=image/png&service=wms&transparent=true
- After launching Google Earth, choose Add/Image-overlay and use the following parameters:
- Name: MassGIS-street-map
- Link: (paste in the above (Image B) URL)
- Refresh-tab: set "when" to be "after camera stops"
- Here are the images returned as Image A and Image B from the MassGIS server:
Image A: MassGIS Roads Overlay (in State Plane Coordinates) Image B: MassGIS Roads Overlay (in lat/lon) 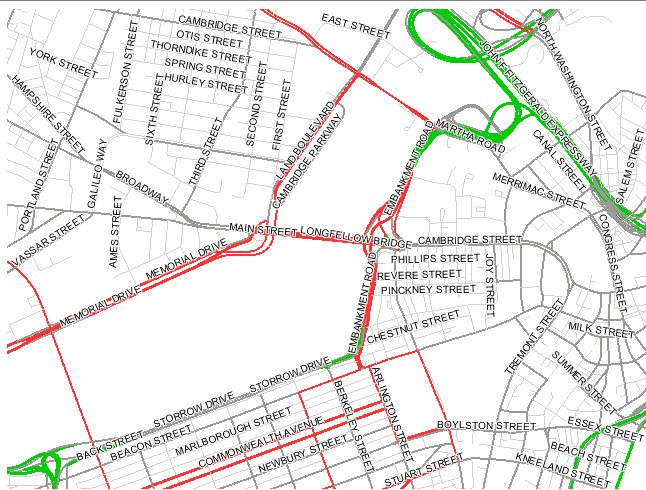
- ArcGIS version 9.2 has trouble with WMS servers such as at MassGIS - ArcGIS version 9.3 is better but not in the lab.
- Explore "GeoModeling" with Google Earth and Sketchup
- In Google Earth, zoom in to the MIT campus
- Place a to-scale model of Eiffel Tower on Briggs Field
- Choose Add/Network-Link and select this file: M:\data\sketchup\eiffel_08nov06_v1.kmz
- Keep Google Earth open and start Google Sketchup as well
- Open the saved Eiffel Tower sketchup file in: M:\data\sketchup\eiffel_mit_08nov.skp - which is the following AFS locker folder:
- /afs/athena.mit.edu/course/11/11.520/data/sketchup/eiffel_mit_08nov.skp
- Click the "view your model in Google Earth" button (3rd from right side of tool bar)
- The sketchup model will be placed into Google Earth in the same location as determined by SketchUp from the registered image that came from a Google Earth snapshot (when the saved KMZ file was made)
- Some machines in the MIT labs will not allow this method of moving 3D models from SketchUp to Google Earth (do to file writing permission issuses). In that case, from Sketchup, choose File/Export/3D-Model and save your model to disk in KMZ format (zipped keyhole markup language, KML). Then open the file in Google Earth via Add/Network-Link.
- Open the saved Eiffel Tower sketchup file in: M:\data\sketchup\eiffel_mit_08nov.skp - which is the following AFS locker folder:
- Turn on 3D buildings in Google Earth and examine the scale of the Eiffel Tower compared with the playing fields and MIT buildings
- Explore additional Google Earth and Sketchup capabilities - e.g., you can drape photos onto wire frame building models so the photos provide a realistic facade for the buildings
- In Google Earth zoom to again to MIT campus looking pretty much straight down
- In a blank Google Sketchup window, click the "Get Current View" toolbar icon to grab the surface image and location of you Google Earth location
- Now build a sketchup model (for example a box)
- Finally, click the "view your model in Google Earth" toolbar icon to move your model into Google Earth
- For more information about downloading and using Google Earth and Sketchup see:
- Downloading Google Earth: http://earth.google.com/
- Downloading Google Sketchup: http://www.google.com/sketchup/download/
- Geomodeling with Google Earth: http://sketchup.google.com/support/bin/topic.py?topic=13681&hl=en
- How to place a Sketchup model in Google Earth: http://sketchup.google.com/support/bin/answer.py?answer=36241&topic=13681