Massachusetts Institute of Technology - Department of Urban Studies and Planning

11.520: A Workshop on Geographic Information Systems
11.188: Urban Planning and Social Science Laboratory

Georeferencing, Digitizing & Advanced Raster Operations


October 22, 2008, Joseph Ferreira
(based in part on '06 Lecture by Michael Flaxman)


Administrative

  • Lab Exercise #6 due Monday (Oct. 27), Lab #7 due Monday, Nov. 3, Lab #8 due Nov. 10 (last lab)
  • Homework #2: Part 2, due in two weeks (Nov. 5)
  • Project Proposals: Short (<1 page on topic, intention, and data sources) proposal due on Stellar by Friday, Nov. 7
  • Homework #3: Raster Analysis and ModelBuilder, Part 1 due Friday, Nov. 14; Part 2 due Wed. Nov. 19

Today

  • Finish ArcGIS Demo of Raster Modeling setup
    • Last Wed. my laptop did not have the Spatial Analyst extension installed
    • Today: Demo setup of Spatial Analyst and creation of Cambridge grid cell layer
    • Monday: Lab #7 - Raster Spatial Analysis: Estimate the housing value 'surface' for Cambridge
  • Creating GIS Data from non-GIS sources
    • Previously: create point shapefile from X,Y points in a table (e.g., centroids of blockgroups)
    • Discuss other ways today:
      • From imagery, CAD files, digitizing
      • From mailing addresses (geocoding, georeferencing, or address matching)
  • Introduce advanced raster analysis methods


Creating GIS Data from Non-GIS Sources

Common sources

    Raw Imagery

    CAD Files

    Digitizing

    Addresses

Different sources, different methods

    Raw Imagery

      1. Georeference (if necessary)
      2. Classify (by Color/Spectral Characteristics) or
      3. Digitize (aka Trace)

        GeoReferencing Imagery

        Georeferencing Imagery

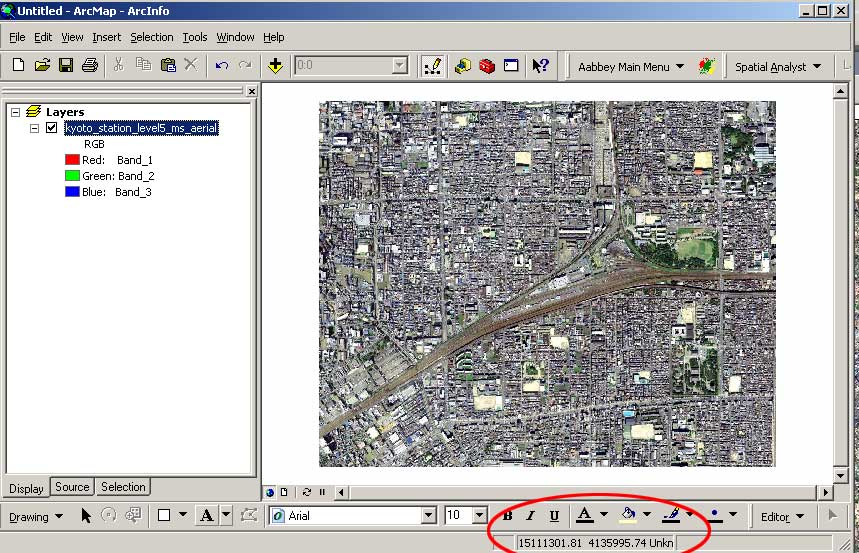
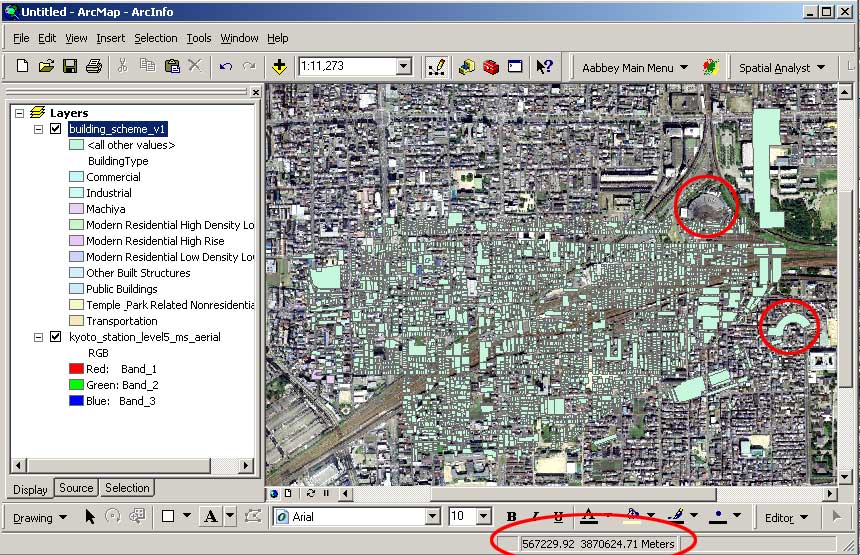
        Note: JPG and TIF images can be directly read into ArcGIS. But by default, they won't have an appropriate coordinate system and won't overlay anything else. (JPEG 2000 and GeoTiff are standard formats that are not always supported but can save coordinate system metadata information along with the image.)

        So we need some data with a coordinate system we trust. (Warning: Google Earth, etc. can be *very* imprecise internationally - see error in this image below).

        Georef Step 2

      So, now we have a valid coordinate system, but our image is clearly pretty far from being correctly registered.

      The solution? The "Georeferencing Toolbar" (View->Toolbars->Georeferencing). This tool allows you to draw one, or several links.
      • If one link, does a simple shift.
      • If multiple links, does a more complex transform (linear, or fancier).

    CAD Files

    Can simply "open" most common CAD files directly in GIS (DXF, DWG, DGN)

    For example, from a real world project, CAD data for a regional plan as created by Fonatur, the Mexican national tourism/development agency.

    CAD in GIS

    Important limits:

    "attributes" don't come along, only layer names *therefore you are well-advised to know the layer naming/numbering convention* (and if none - a big messy problem).

    objects must be "exploded" in CAD before export

    solids must be converted into boundary representations

    Common problems / solutions

    Drawn "to scale", but often without explicit projection information and not North aligned

    Solution 1: layer properties dialog allows specification of transformations

    CAD Manual Transform

    Solution 2: "world files" (*.wld) are simple text files documenting transforms

    CAD World Files

    Why bother with "world files"?!!! Scalability: one world file can be replicated and applied to many CAD documents drawn against the same base.


Digitizing - Creating new (georeferenced) Geometry

Vector Data Model - Requires boundaries with X,Y coordinates

  • Old method - large digitizing table with 'puck' on top of paper map
  • New method - 'heads up' digitizing on-screen on top of image
  • ArcEdit provides a rich assortment of geographic feature creation tools
    • And, is complex and often counter-intuitive
  • ArcSketch provides feature creation tools that are much simpler and intuitive
    • But, is not installed with ArcGIS 9.2 even though freely downloadable
      • From http://www.esri.com/software/arcgis/extensions/arcsketch/index.html
      • Requires Microsoft .Net Framework Version 2.0 (for ArcSketch 1.2 with ArcGIS 9.2)
  • We will demonstrate use of ArcEdit to create a new shapefile of polygons via 'heads up' digitizing from the NGS-TOPO arcwebservice provided by ESRI.
    • Must first create empty shapefile in ArcCatalog
      • specify polygon features
      • specify Mass State Plane (NAD83) mainland coordinates
    • Add this empty shapefile, newpolys.shp, to a Data Frame in ArcMap
  • Use ArcEdit to create polygons in your new shapefile
    • Turn on the 'Editor' toolbar from View/Toolbar
    • Specify newpolys.shp as the file to be edited
    • Create a few polygons
    • Examine attribute table and figure out how to add additional attributes
    • Try out various editing tools to move, snap, and adjust features
    • Recognize complexities: overlapped vs. shared boundaries; moving shared points, choosing an appropriate level of detail, handling curves, labeling points, lines, polygons,...

    Addresses - Requires 'Geocoding'

    What is Geocoding

      • Geocoding is a process of creating map features from addresses, place names, or similar textual information based on attributes associated with a referenced geographic database, typically a street network that has address ranges associated with each street segment or 'link' running from one intersection to the next.
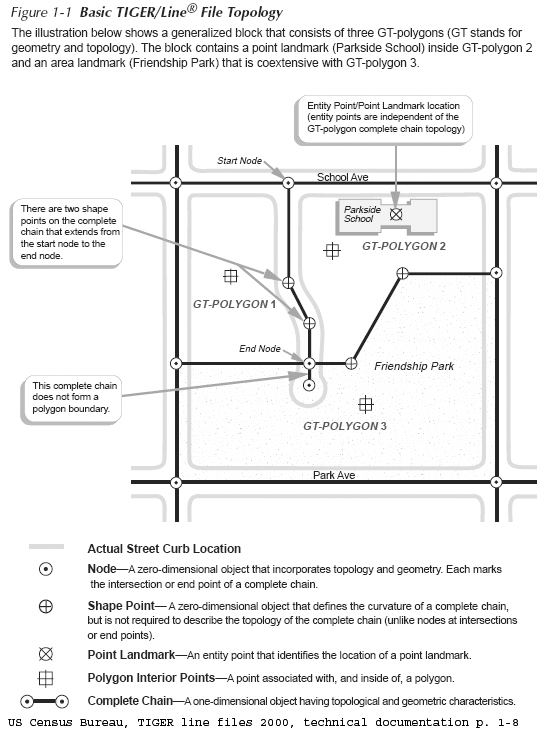
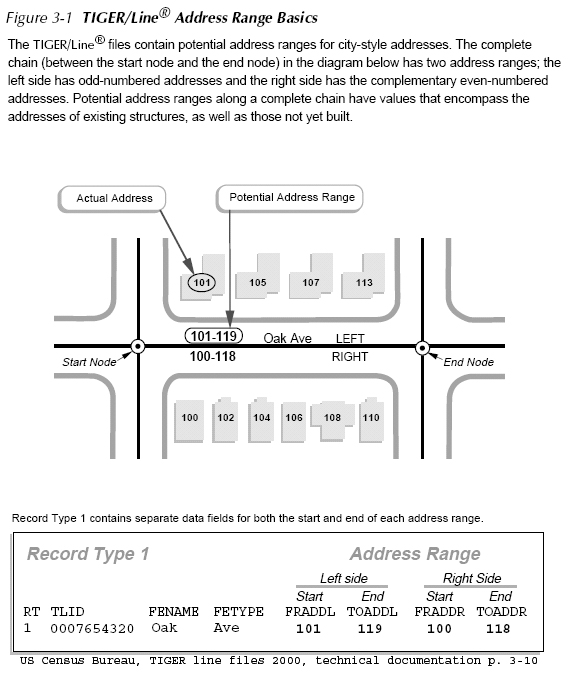
      • Geocoding typically uses Interpolation as a method to find the location information about an address. 
        • (If the address along one side of a block range from 1 to 199, then Street Number = 66 is about one-third of the way along that side of the block.)
      • Data required:
        • Reasonably clean, consistent list of legal addresses (i.e. not too many typos, addresses really exist, etc.)
        • Address range attributes on a linear street network
          • Most commonly from Census
          • More current/cleaner data available from private vendors
      • Geoprocessing as a "Service"
        • Basic setup even in desktop ArcGIS
          • First, in ArcCatalog, create "Address Locator", feeding it street network with addresses + parameters
          • Second, in ArcMap,


Geocoding Process

  • Converting textual addresses and names to X,Y locations
  • Address matching - develop point map from mailing list
  • Lookup place names in a 'gazeteer' to find lat/lon, zip, place boundary, voting district, etc.
  • General 'service' to translate among geographic identifiers
  • Examine ArcGIS geocoding services
    • Focus on address matching using TIGER-style street centerline data (with address ranges)


Data needed for geocoding

1. A list of addresses stored as a database table or a text file;

2. Georeferenced features linked to the address database (such as a street centerline shapefile with street names and address ranges stored as attributes of the shapefile)

Geocoding

A geocoding service, which is a configuration file that specifies the georeferenced feature layer and its relevant attributes, and various rules and tolerance for use in the matching.

GeoCoding Setup

Address Locator

The output of the geocoding is a point file stored as either a shapefile or a geodatabase in ArcGIS.


GeoCoding Results

Example: using US Census Bureau, TIGER Line Files (as source info for geocoding)

  • Geocoding Strategy using TIGER
    • Encode road network as street centerlines
    • Attach address information to each street segment
    • Use 'in reverse' to match street address to street segment to get approximate X,Y location
  • TIGER: Topologically Integrated Geographic Encoding and Referencing system
    • http://www.census.gov/geo/www/tiger/
    • US Census Bureau TIGER line file 2000, technical documentation
      • at Census: http://www.census.gov/geo/www/tiger/rd_2ktiger/tgrrd2k.pdf
      • in class locker: http://mit.edu/www/data/census2k/tiger_tgrrd2k.pdf
  • Illustrative Example
    Street centerline road segments
    Attaching address ranges to road segments

Geocoding Example: Chapter 17, exercises a, b, and c in Ormsby
  • Convert mailing list of neighborhood address to a point shapefile
    • Exercise 17a: create a 'geocoding service' using
      • Street centerline shapefile with address ranges (TIGER-format)
      • Attribute information consistent with address information in mailing list data table
    • Exercise 17b: use the geocoding service to 'address match' all the easy cases
    • Exercise 17c: use the interactive tools of the geocoding service to handle the tough cases
  • 'Crib Sheet' of steps for Exercises 17a: create geocoding service
    • Add street shapefile and mailing list table to your ArcMap session
      • Examine layers to see what they have
      • Don't need to open this shapefile and table in order to create geocoding service
    • Open ArcCatalog and create a new gecoding service
      • Select US Streets with Zone style
      • Select street shapefile that contains address ranges
      • Match attribute columns of street file and mailing list in order to cross-reference
      • Note that the name of the geocoding service includes your user name
  • 'Crib Sheet' of steps for Exercises 17b: use the automatic geocoding service
    • Add street shapefile and mailing list table to your ArcMap session
    • Tools/Geocoding/Geocoding-Services-Manager/Add-gecoding-service
    • Add the service you created in 17a
    • Use Find button on toolbar to locate individual addresses
      • Enter address by hand
      • Create graphic annotation showing location (but don't save as shapefile)
    • Use Select Elements button on toolbar to
      • Automate address matching of easy-to-match addresses (Note use of quality-of-match index)
      • Save results as a shapefile of point features
  • 'Crib Sheet' of steps for Exercises 17c: tweak the automatic results
    • Add street shapefile and 17b output to your ArcMap session
    • Tools/Geocoding/Review&Rematch-Addresses
    • Use Geocoding-Options and Interactive-Review to
      • tweak settings/rules for automated matching
      • edit mailing list addresses and match tough cases as best you can

Also: Good Online Example with Sample Data from Paul Cote at Harvard GSD:

http://www.gsd.harvard.edu/gis/manual/geocoding/index.htm


Advanced Raster Analysis

Summarize grid cells values by fixed geometries using zonal statistics

  • Vector case example: summarize suitability across each census blockgroup
  • Use 'zonal statistics' to average grid cell values within each blockgroup polygon

Finding patches using RegionClass command

  • What if we wanted to summarize by real city blocks and only had road centerlines
  • Create block polygons from road centerlines using 'line coverage to region' RegionClass tool (requires ArcInfo license)
  • Use block IDs to distinguish each 'patch' so zonal sum will compute block average

Moving window analyses
    Sometimes we don't have a fixed geography
    Want to summarize clusters of occurrences
    Example: land use mix (within classic pedestrian 1/4 mile)

CostDistance
    Simplest form: mask out excluded areas, cost equal elsewhere
    Example: cost distance from bookstores
    In general, urban grid makes accessibility relatively even
    But note case of Charles River


Created by Joseph Ferreira and Michael Flaxman, 2005-2006
Last modified 22 October 2008, Joe Ferreira
Back to the 11.520 Home Page.

Back to the CRON Home Page.