11.522 UIS Research Seminar (Fall 2015) Discussion notes
Monday, Oct 26 and Nov. 2, 2015
Using decision support tools to improve community process around transit expansion
Discussion Leader: Jeff Rosenblum
Mon. Oct. 26: Brief introduction to the topic in class
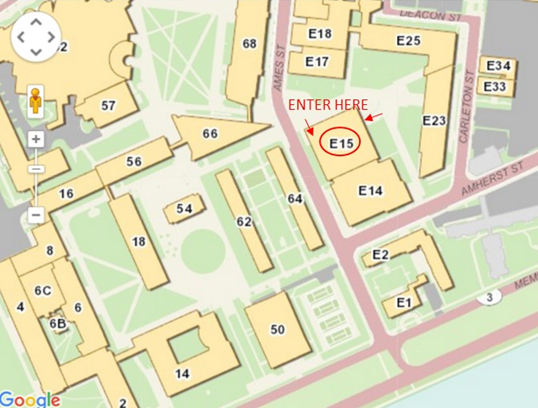
Mon. Nov. 2: MEET AT E15-368 (3rd floor of the Media Lab). I will give a 30-minute presentation, then a 45-minute demonstration on the tools, and then have a discussion for the remainder of the time.Engaging the public on transit expansion projects has become ever more important. Traditional community meetings are generally at either end of a spectrum: very general input gathering about community concerns and desires, and auditorium-style presentations and questions about detailed proposals. Understanding the assumptions, the dynamics, impacts, and uncertainties of possible transit improvement scenarios are lacking. Government agencies need better tools for engaging stakeholders in the process of developing and evaluating possible solutions. To address this need, a web-based mapping and visualization tool is under development by researchers at MIT called COaX. A series of workshops in Fall 2015 engaged the Roxbury community using potential Bus Rapid Transit corridors in Boston as the transit improvement. Preliminary results indicate that accessibility measures can effectively connect complex technical analyses with narratives more easily understood and used by community stakeholders.
For the Monday, Oct. 26, session, we skimmed the Hidalgo and Gutierrez article providing background on ‘bus rapid transit’ (BRT) efforts around the world. We also reviewed the ITDP document that spells out design and performance standards in order for a bus system to be considered BRT. The other two documents should be read prior to Nov. 2. The Barr Foundation document focuses on BRT opportunities in Boston and the Steward and Zegras paper describes the tools that we will examine on Nov. 2. The readings are in the class locker and also on Stellar. Jeff has also made them available from Dropbox using the links added below to each reading in the list..
Discussion Questions
- There are two approaches that can be taken in using scenarios in public engagement. One is to provide a more limited set of pre-vetted options for users to explore. The second is to allow for more of an “anything goes” where participants can build a scenario of anything. Pros and cons? From the planner’s perspective and the users perspective? Inherent political problems with the former?
- What are advantages and disadvantages of the use of each of the three scales from a community member’s perspective? How might each of the models add to the facilitation of learning by the participants? What visualization characteristics of each scale make for easier perception by the participant? Harder?
- We had some good discussion of “model assumptions” during our last class. How do these issues play out for the three different scales?
Readings:
Hidalgo, Darío, and Luis Gutiérrez. 2013. “BRT and BHLS around the World: Explosive Growth, Large Positive Impacts and Many Issues Outstanding.” Research in Transportation Economics 39 (1). Elsevier Ltd: 8–13. doi:10.1016/j.retrec.2012.05.018. (Click here.)
Stewart, Anson, and P. Christopher Zegras. 2015. CoAXs: Interactive Mapping for Measuring and Communicating Transit’s Accessibility Impacts to Support Co-Creative Planning. (Click here.)
“The Barr Foundation.” 2015. Better Rapid Transit for Greater Boston. (Click here.)
Institute for Transportation and Development Policy (ITDP). 2013. BRT Standard. (EXCERPTED PAGES) (Click Here.
============= directions for Nov. 2 demo in Building E15 =========================