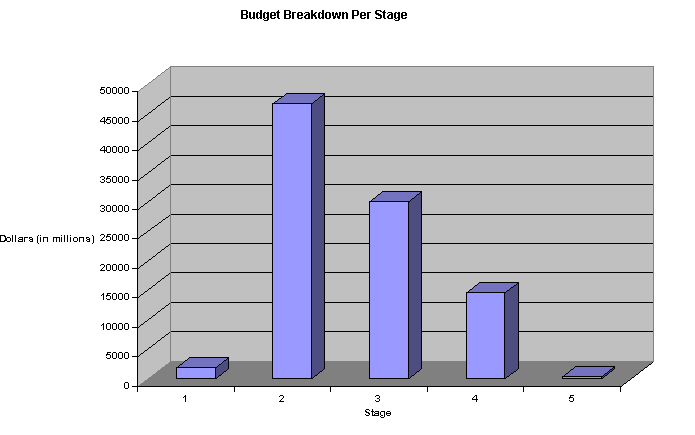
In order to formulate the budget, we had to establish a timeline for the mission. We decided that the mission should be spread out over a time span of twenty years because it would be more feasible to ask Congress for smaller increments of money over a longer period of time rather than an enormous lump sum. Although this made the budget easier to formulate, the plan forced us to devise a much more elaborate public relations campaign because it will be necessary to maintain both public and congressional interest in the project. The following timeline was devised: Years 1-2: Planning; Years 3-11: Research and Development; Years 12-15: Construction; Years 16-18: Flight; Years 19-20: Analysis. Although not all aspects of the mission will follow the proposed timeline precisely, the timeline serves as a general overview of the project's stages.
We determined the amount of money that
should be allocated to each team by primarily analyzing the budget for
the Apollo
mission. We found that the Apollo mission used approximately 60% of
NASA's annual budget in the 1960's. It is therefore reasonable to assume
that a mission to Mars, which would be of the same magnitude as Apollo,
could also use 60% of NASA's annual budget. With an average budget of $14
billion in the 1990's, we estimated that the mission could take an average
of $7 billion a year, or a maximum of $140 billion over 20 years. With
this figure in mind, the next task was to divide the funds among the seperate
components of the mission. In order to do this, we compared the aspects
of the mission to the analogous aspects of Apollo and past Martian exploration
missions, and we formulated a proportional cost for that component today.
Secondly, we communicated with the teams to determine exactly what their
functions included and to obtain a self- estimate of their project's costs.
Some assumptions had to be made regarding the mission plans. For example,
we assumed that the "to and from vehilce" team would be responsible for
purchasing the fuel, and thus should receive the appropriate funding. We
also assumed that the environmental team would be responsible for purchasing
food and other life- sustaining items necessary for the crew, and that
the mission control team would be responsible for the creation of a control
center, an around- the- clock staff, and communications panels to oversee
the mission. From this assessment of the teams, we determined approximately
how much money each team should receive, and the resulting budget is displayed
in the graph below.
Year To and From
Vehicle DesignSurface
TransportScience
TeamExperimental
DesignBudget Instrument
DesignMission
ControlCommunications
and SoftwareNavigation Environment 1 140 140 93 93 46 93 46 93 93 140 2 140 140 93 93 46 93 46 93 93 140 3 1000 700 467 467 233 467 233 467 467 700 4 1000 700 467 467 233 467 233 467 467 700 5 1000 700 467 467 233 467 233 467 467 700 6 1000 700 467 467 233 467 233 467 467 700 7 1000 700 467 467 233 467 233 467 467 700 8 1000 700 467 467 233 467 233 467 467 700 9 1000 700 467 467 233 467 233 467 467 700 10 1000 700 467 467 233 467 233 467 467 700 11 1000 700 467 467 233 467 233 467 467 700 12 2500 950 587 610 293 595 293 587 587 880 13 2500 950 587 610 293 595 293 587 587 880 14 2500 950 587 610 293 595 293 587 587 880 15 2500 5 587 93 293 595 293 587 587 880 16 4000 5 540 93 20 540 280 540 540 1000 17 5 5 540 93 20 540 280 540 540 1000 18 5 5 540 93 20 540 280 540 540 1000 19 5 5 100 33 5 5 5 5 5 5 20 5 5 100 33 5 5 5 5 5 5
Comments and questions to mission2004-students@mit.edu Last updated: 10 December, 2000 |