This is a possible monitoring system, and is from the
NASA site: http://southport.jpl.nasa.gov/amazon/imagebrowser/jamms.html
NASA worked on a project called "Global Rainforest Mapping
project (GRFM) by an orbiting spacecraft using radar imaging, (Japanese
JERS-1 Synthetic Aperture Radar (SAR)). This was begun in mid-1995 and
was to be completed by 1997 in terms of data collection and processing
for all the world's rainforests. Such SAR satalites are in use by the US,
Japan, European Space Agency, and Canada (the previous Soviet Union as
well, though I am unsure of their current practices). The first SAR mapping
of the Amazon (during low flood season) took 62 days. Another was done
during high flood season The advantage of SAR technology is its ability
to be used at night and to see through clouds (since some areas of the
rainforest are always under cloud cover.) This previously recorded data
may be useful since an understanding of the extent of flooding is vital
in a model of the carbon cycle and possibly climate change. Continued use
of the technology may be a way to monitor how flooding changes with development.
The abstract I found consisted of summaries of different suspended-sediment techniques and references. I will list a few that looked promising for us.
Optical Backscatter (OBS): Shine light into a sample volume and measure reflected light using photodiodes posisioned around the emitter. This requires an imperical calibration to convert the measured backscatter to concentration. Measurement sample volume "is on the order of several cubic centimeters." This can best measure particle size from 200-400micro meters, and concentrations of up to 100g/L. Apparently these divices are redily available and relatively inexpensive. The problem of course is that it requires man power at the site of measurement to do the collections and run the tests. There are many similar techniques inluding optical transmission where you measure the amount of light that comes out the other side of a sample rather than the that amount reflected. Slight variations include using lasars and measuring diffraction or reflections.
Acoustic: Emit short bursts of high frequency sound from a transducer (short meaning on the order of 10 micro seconds long, high frequency meaning about 1-5 MHz). The sediment will reflect a certain amount of the sound depending upon the concentration, particle size, and frequency. If you use multiple frequencies you can determine both the particle size (in a range from about 62-2000 micro meters) and concentration (up to 30 g/L) This technique can also be used to measure a verticle profile of sediment concentrations for depths of 1 or 2 m. The acustic technology is still under development, because while the hardware is available, there is no commercial hardware/software system to use this technique.
Spectral reflectance: Suspended sediment concentrations are measured using the amound of radiation reflected from a body of water and the properties of that water. This can be measured using a handheld , airborne, or (luckily for us) satellite based spectrometers. One major advantage is being able to measure a much larger area, and can measure up from one square meter to one square kilometer at once. Because of the sheer size of the Amazon river, this is more useful.
Digital optical: "A charge-coupled divice records
the sediment/water mixture in-situ." It can be analyzed for size and concentration
of suspended sediment particles, and to confirm the nature of the sediment.
It is still in development stages, and is dependant on light penetration.
Ideally a computer could anylize the light penetration and hence the soil
size and concentrations and all this could be controlled remotely.
As we searched for a remote monitoring possibility, the
idea of analyzing colors on photographs to determine sediment concentration
was suggested by Proffessor Kip Hodges. There is a simlar technique being
developed for use in oceans, but it is unknown if this would work with
rivers because of the vast changes in river depth and the complicated nature
of the river bed topography. It would be necessary to collect on site data (not
necessarily from the Amazon, perhaps somewhere more easily accessible to
the research team such as the Mississippi) and compare it to various satallite
images taken at the same time. If a correlation could be drawn, the next
step would be to write a computer program that held the actual data and
could run comparisons to produce sediment load from new images. If
a correlation could not be found, this method will not be useful.
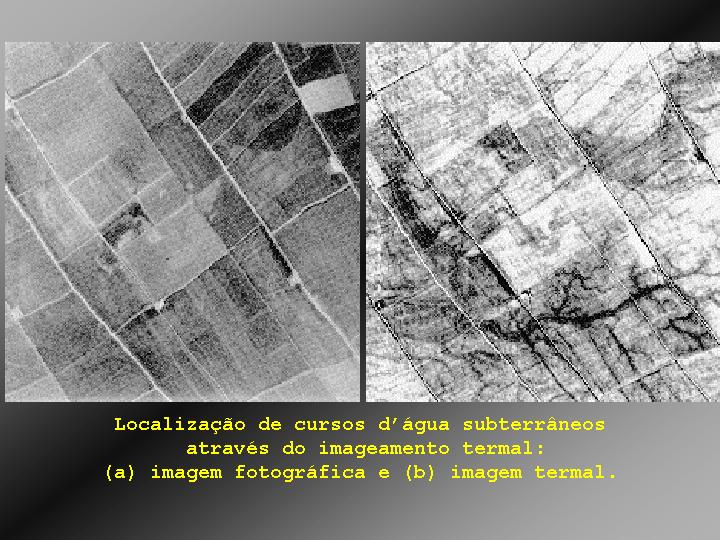
The picture on the right is a regular
photograph. The picture on the left was taking using thermal imaging technology
that will be employed by the SIVAM data collecting airplanes to locate
underground water flows. You can see the darker spots where subterraneous
water is in greater concentrations. This is really only a mapping tool
and is not useful in determining chemical composision of the ground water.
In regards to the actual chemical composition of the water, Hydrolab (http://www.hydrolab.com) has something called a "Quanta-G water quality insturment" which is designed specifically for ground water monitoring. It measures temperature, specific conductance, salinity, total dissolved solids, dissolved oxygen, pH, oxygen reduction potential, depthm and vented level. It monitors up to depths of 100m. New users can be trained in 30 minutes or less according to the advertisement, which is advantageous if we want to train indigineous people get them involved.
The multitemporal satellite imagery (Landsat TM and RADARSAT) can be used to locate groundwater trapped by dykes in precambrian basement terrains. I remember reading that the Rio Negro has little sediment because it originates in basemnet rock, so this may be relevent. However, it is mostly used to locate water sources, and because of the large amount of participation this is not an issue as far as I know. (http://www.casi.ca/20rsabs2.htm)