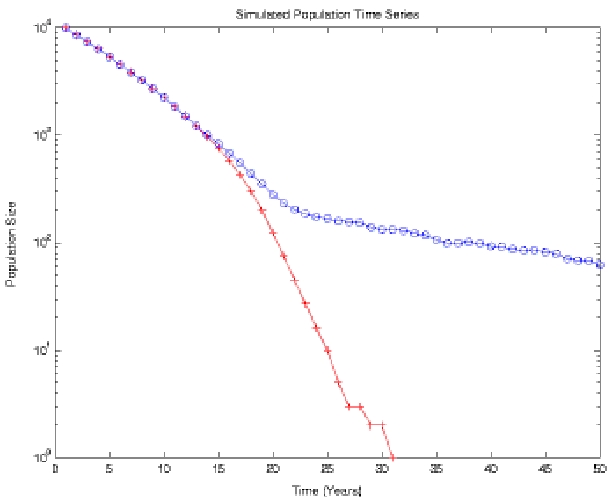
Fig.10 Logarithmic Plot of Population versus Time
ArcView
ArcView GIS is the central tool used by this second group, along with several add-ons to the program, specifically 3D Analyst, Image Analysis and Spatial Analyst. We worked through the basics with Sarah E. Williams, GIS specialist at MIT. She has given us permission to have licensed copies for ArcView for our personal computers, as well as given us online tutorials to begin with.
What is ArcView?
"ArcView gives you the power to visualize, explore, query, and analyze data geographically. In no time, you'll be working with your data in a completely new way, seeing patterns you couldn't see before, understanding geographic relationships that were previously hidden, gaining insights, solving problems, and achieving new results . . ." ~ ArcView GIS User Manual by ESRI (Environmental Systems Research Institute Inc.)
Our group develops a model that allows us to determine the probability that a specific species has of going extinct under certain conditions during a fixed time span given its current population size. This process is known as Population Viability Analysis (PVA). We use ArcView GIS 3.3 for developing this model. More specifically, we use one of ArcView's extensions or add-on programs that provides specialized GIS funcionality, called ArcView Spatial Analyst. This extension contains a tool known as Population Viability Analysis that allows one to create life tables based on overall population parameters or utilize a fully populated life table to conduct multiple population simulations. [From ArcView GIS manual, Environmental Systems Research Institute Inc., 1996]
It is important to understand that the extinction process involves both deterministic processes as well as stochastic processes. Deterministic processes include over-harvest, habitat destruction, competition or predation from introduced species, while stochastic processes cover random variation of demographic and genetic events and the effect of environmental variation on demographic and genetic events. Keeping this in mind, a PVA should concentrate on the identification of natural and human factors that have a direct influence on the specific population under study, as well as conservation and management options. The main objectives when developing a PVA are creating a way to minimize the species' risk of extinction and also to promote conditions in which species retain their potential for evolutionary change without intensive management.
Our PVA model
Policymaking and Biological Modeling
In order to allocate conservation resources efficiently, it is necessary to know whether various preservation plans are likely to succeed, and what their overall effect will be. The effect of different plans may not be easily predictable. Modelling can help in the creation of environmental policy by providing better information about the likely effects of various ecological policies. As an example, this page presents an application of a type of modelling known as Population Viability Analysis, but the results are applicable to all types of biological models.
Population Viability Analysis, or PVA, is a broad class of techniques for predicting whether or not a population will survive, and for how long. Simple PVA techniques include linear extrapolation of current population trends, as well as fitting to more complex curves. The approach used here is a more sophisticated model built from first principles. For this demonstration, we simulated a hypothetical animal species, computing its population each year from the age structure of the population during the previous year, as well as the probability that an individual at a given age will die or reproduce. Additionally, the population was assumed to have a density-dependent birthrate, such that while the species remained above the theoretical carrying capacity of its environment, any newborns would not survive past one year.
We used prototype software known as PVA Table Tools for ArcView GIS developed by Dr. Phillip Hooge of the Biological Science Office at the US Geological Survey's Alaska Science Center to simulate the response of two species with identical overall death rate, birth rate, and other parameters to a drastic reduction in carrying capacity. Both populations were initialized at 10,000 individuals, with an environment carrying capacity of 1500. The only difference in the simulation was the age-specific reproduction rates. One species was reproductive from age 4 until death, at age 20. The other species was twice as fertile, but only over the first half of that range.
Fig.10 Logarithmic Plot of Population versus Time
The results show a clear distinction in behavior from this comparatively subtle difference. The species behave identically for 13 years, after which one species goes extinct and the other stabilizes. In case it isn't clear from this graph, we've run the simulation out past a century and the population in blue does stabilize.
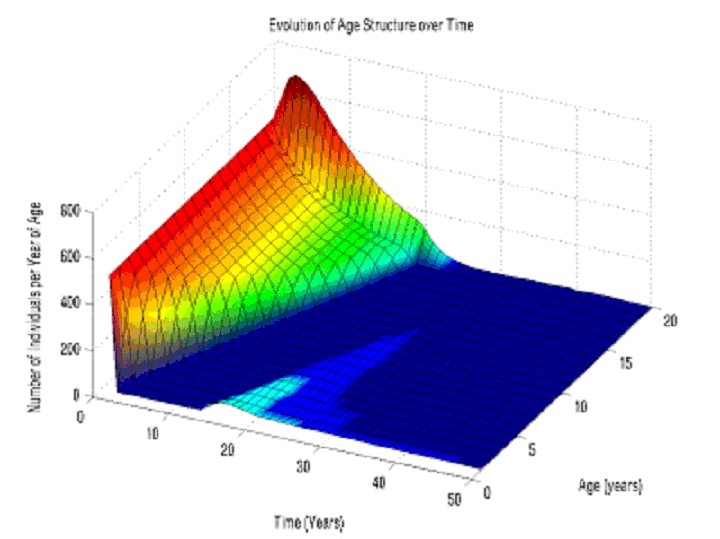
Fig11.Age structure of the surviving population over time
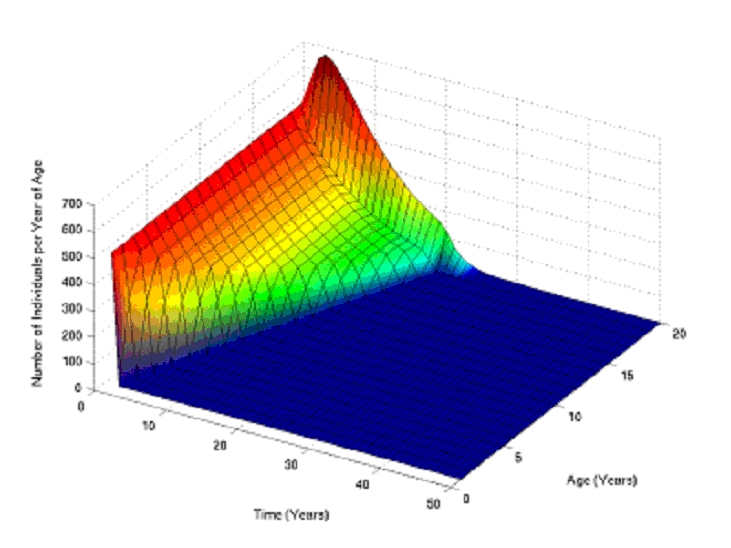
Fig.12 Age structure of the extinct population
The reason behind the distinction is clearer in these graphs. The dark blue regions indicate that few or no individuals were present at that age at that time. Thus, both graphs show a hole in the age structure that moves as a lack of surviving one-year-olds becomes a lack of surviving two-year-olds, and so on. However, the surviving species shows a baby boom of one-year-olds as the population passes below the carrying capacity, whereas the other species does not. This is because by the time that population has dropped below the carrying capacity, there are no longer any individuals of reproductive age left in the population.
If conservation policies are made
on the basis of overall characteristics of a species, such policies would
be unable to distinguish these two species. As a result, the species
truly headed
for extinction might be allocated
insufficient resources to survive, while personnel and funds might be wasted
on the second species, whose numbers would ultimately have stabilized anyway.
Although this model is relatively simple, PVA simulations can incorporate much more complex effects such as the loss of diversity due to inbreeding, habitat fragmentation, and even rare calamities, such as floods. They may also be integrated with Geographic Information Systems to incorporate landscape properties. Such intricacies, while necessary for complete models of real species, are not necessary to demonstrate that modelling allows us to know much that we otherwise could not.
In this artificial case, and in general, decisions made without adequate information can have disastrous environmental results. Both extensive monitoring and modelling will be necessary in order to preserve the Amazon rainforest.