What is VenSim?
With VenSim, there are two sets of controls: there are the ones used for making the model and there are the ones used for analyzing the data. The modeling controls are pretty basic - level variables, rates, flows, and connector arrows. The most important part of modeling is to know what equations to use to connect these different objects. VenSim has several functions already built in (such as Step, Natural Log, Smooth, If Then Else, Random, etc.) and the user can define his or her own equations as well. VenSim also has a built in units check to make sure that everything works together.
Another interesting and useful feature in VenSim is called "Reality Check." This feature makes sure that the theoretical equations used stay within the bounds of reality. For instance, we might have the statement
(Total Animals) = (Amount of forest) / (Forest needed per unit animal * Total Animals) + New Births
Now we know that if there is no forest then there can be no animals, but this equation could let Total Animals > 0 even when Amount of forest = 0. So we enter into "Reality Check" that if Amount of forest = 0, then Total Animals = 0. Not only will "Reality Check" automatically enter these values when they are necessary, but it will also alert the user as to the exact time that he or she is possibly "breaking" reality, meaning when the equation gives an answer contrary to the "Reality Check".
The other half of VenSim is data analysis, used generally after a simulation has been run. Several methods of displaying the results can be used through VenSim, including graphs, tables, and causes strips. For all of these methods one can save data from each simulation to a different file name, and then display both sets of data on the same graph, table, etc. This makes it very convenient to run an experiment with a set of controlled variables and constants, and then see how greatly varying one factor, can affect the equilibrium. The user can repeat this as many times as desired, and still show all the data outputs on the same graph. Also, all the graphs and tables can be saved as normal pictures, making them very easy to output to a presentation.
The other resource helpful in learning about system dynamics programing is "Road Maps." This is an online tutorial created by MIT students under the guidance of Professor Forrester, and can be accessed at http://sysdyn.mit.edu/ . Each chapter of this tutorial provides guidance through a set of readings and exercises that allow for a better understanding of system dynamics and for a new way of thinking, which enables the user to create innovative computer models of systems.
Our Vensim Model
We use Vensim to model the carbon
cycle as follows.
The Carbon Cycle and The Amazon Rainforest as a Carbon Sink
Introduction
Since the Industrial Revolution,
society has been adding carbon to the atmosphere by deforestation and fossil
fuel emissions. Over the past 140 years, roughly 350 Gtons of carbon
have been dumped into the atmosphere by human activities (Chameides &Purdue,
1997). Today it is estimated that carbon is released into the atmosphere
at a rate of 6.25 Gt C/year from fossil fuel emissions and 1.7 Gt C/year
from deforestation (FAO, 2001). This has become cause for concern
because we now believe that CO2 acts as a Greenhouse gas, preventing heat
from leaving the atmosphere and leading to a trend in global warming.
One of the major arguments
for the preservation of the Amazon rainforest is that it acts as a carbon
sink, absorbing more carbon than it emits, and therefore helping to reduce
atmospheric Greenhouse gases. This, however, is a highly debated
issue in the scientific community, with some scientists agreeing with this
theory and others claiming that the Amazon actually gives off CO2.
Therefore we decided to create our own model of the carbon cycle to assess
its potential as a carbon sink.
The Model
The book Biogeochemical Cycles – A Computer-Interactive Study of Earth System Science and Global Change by W.I. Chameides and E.M. Purdue gave a basic model of the world carbon cycle in the pre-Industrial age. This was a steady-state model. The book also discussed certain ways to change the model to attempt to describe the carbon cycle since 1860, the time when emissions of CO2 started.
While this model was informative
about the entire carbon cycle and did point to the fact that carbon was
being absorbed by the terrestrial biosphere, it did not help us to understand
the Amazon Rainforest’s role in this process. Therefore we decided
to alter this model by splitting up the stock of carbon in the terrestrial
biosphere into two groups: the stock of carbon in the Amazon and the stock
of terrestrial carbon in the world minus
the Amazon Rainforest carbon stock.
Rates of carbon flow between stocks were taken from Biogeochemical Cycles, and generally took the form (amount of flow) = constant * (concentration of carbon in stock). To increase the accuracy of the model, we altered the above rate equation for the air-to-ocean flow and the air-to-terrestrial biosphere flow by introducing the Revelle Factor and the Beta Factor, which were derived in Biogeochemical Cycles. The Revelle Factor was taken as approximately 10, and the Beta Factor as approximately .3. The uncertainty of these values, especially the Beta Factor was noted.
Data on the initial carbon levels of each of the stocks, except for the stocks that we created to look specifically at the Amazon Rainforest, was taken from Biogeochemical Cycles, while the Amazon stock values we derived from data from the FAO’s State of the World’s Forests - 2001.
The following is a pictorial depiction of our model. Boxed variables are stocks of carbon (all in Gtons of carbon), black arrows indicate the flow of carbon (Gtons C/year), and blue arrows indicate that the value of the arrow’s origin affects the value of what the arrow is pointing to. Non-boxed variables are used to denote values of numbers which affect the rates of flow but are not actually carbon stocks.
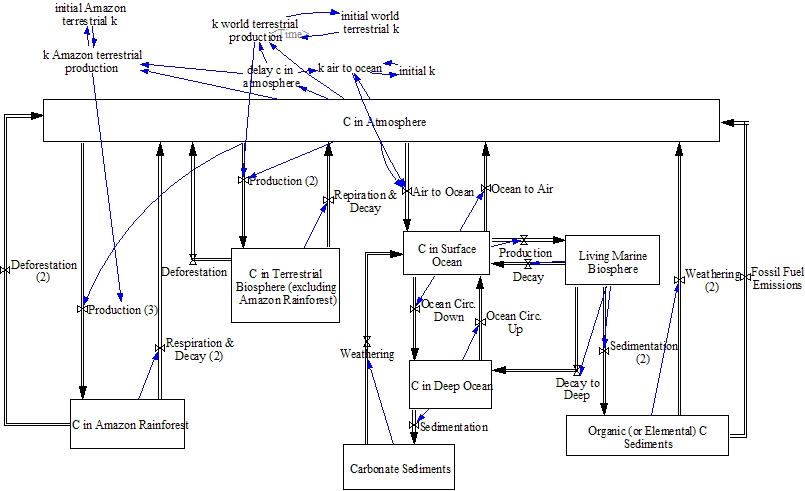
Fig.3 Carbon cycle model
For running this model, certain assumptions about rates of deforestation and fossil fuel emissions were made. To begin with, step functions were used to calculate the historical values of these flow rates. This made calculating the area under the curve (which is the total amount of carbon released since 1860) much simpler. Also, for the purposes of this model, we assumed that the current rates of deforestation and emissions will be continued into the future without a decrease or increase.
Findings
Because many of the data values used to make this model were estimates (many of which were estimated at different levels depending on what source we looked at), we were not looking to find actual values of potential carbon levels, but were rather looking for trends. Taking this fact into consideration, our model made some interesting predictions. Below are the graphs of several stock levels and rates. The time is in years since 1860 (so 140 is present).
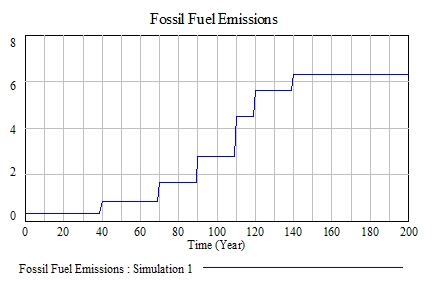
Fig.4 the rate of carbon emitted into the atmosphere (Gtons C/year) from fossil fuel emissions
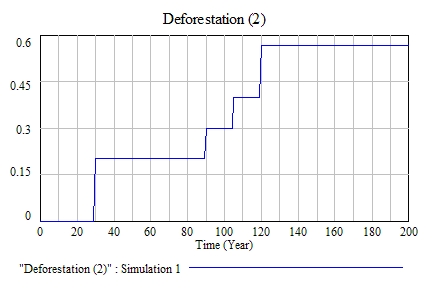
Fig.5 the rate of carbon emitted into the atmosphere (Gtons C/year) from deforestation in the Amazon Rainforest
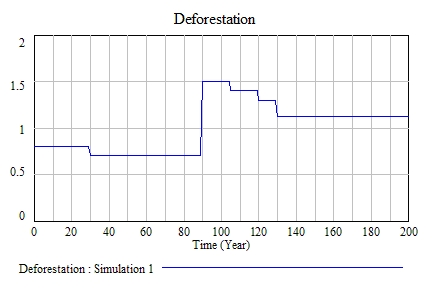
Fig.6 the rate of carbon emitted into the atmosphere
from deforestation the world (Gtons C/year), excluding deforestation of
the Amazon
Rainforest
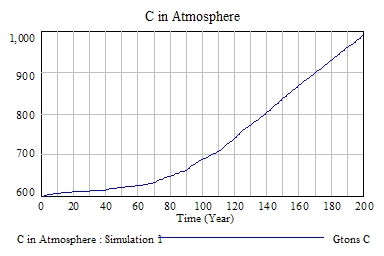
Fig.7 the predicted carbon concentration (Gtons C) of the atmosphere
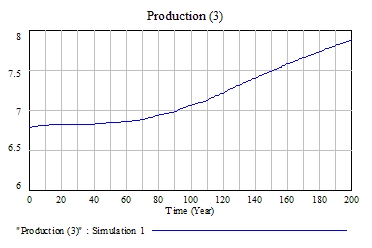
Fig.8 the predicted rate of production (Gtons C/Year) in the Amazon Rainforest
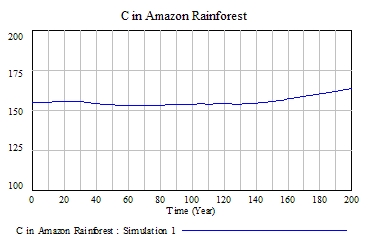
Fig9. the carbon (Gtons C) in the Amazon Rainfores
The most notable idea that this simulation demonstrates is the relatively constant (up to the present) total biomass in the Amazon Rainforest. This would indicate that since about 10% of the Amazon Rainforest has been cut down over the past 140 years, there would need to be a roughly 10% increase in biomass density. In other words, the part of the rainforest that remains alive has been acting as a carbon sink. A 10% increase in biomass density seems to be a large increase, but according to several recent papers (Chambers, et al, 2001) (Phillips, 1998) the time scale has been long enough to allow for this sort of gradual increase. If this is the case, there still will exist a maximum biomass density that the Amazon Rainforest can achieve, after which it will no longer be able to act as a sink.
Other ideas that this model show are: the production of terrestrial biomass increases with increased CO2; the oceans have absorbed about 100 Gtons C; even if all deforestation were to stop instantly tomorrow, there would still be a large rise in CO2; even if all deforestation and fossil fuel emissions stopped tomorrow, we have already disturbed the atmospheric carbon levels so much that it will take a long time, if ever, for them to return to levels in the 600-650 Gtons range.
Conclusion
Because of the possibly drastic
affects elevated carbon levels in the atmosphere could have, it is vital
that we understand what are the major carbon sinks in the world in order
to preserve, and possibly enhance, them. It appears that the Amazon
has been acting as a carbon sink, but it is unknown for how long this can
continue and whether the rate at which it absorbs carbon can keep up with
the rate of carbon emissions. To get a better understanding of the
situation, we must first design a more accurate system for determining
the biomass of the Amazon Rainforest. Also, research should be conducted
to try and estimate at what density level the Amazon can no longer act
as a sink.
Unfortunately it appears
that although the terrestrial biosphere and oceans do act as carbon sinks,
the only real way to lower atmospheric carbon is to lower the emissions.
One way to do this is to decrease deforestation. This has the combined
effect of lowering emissions and providing more forest area to act as a
future carbon sink. Reforestation techniques are also estimated as
having potential to decrease the atmospheric carbon. All of these
solutions point to the fact that it is vital that we slow, and maybe even
eventually stop, the cutting down of the Amazon Rainforest.