13.021 – Marine
Hydrodynamics
Lecture 24B –
Lifting Surfaces
Introduction – What are the characteristics of a lifting surface?
Lifting surfaces in marine
hydrodynamics typically have many applications such as hydrofoils, keels,
rudders, propeller blades and yacht sails. A lifting surface is a thin streamlined
body that moves in a fluid at a small angle of attack with a resultant lift
force normal to the direction of flow.
Consider the foil in figure
1in a uniform free stream. The straight line joining the center of curvature
of the leading edge to the trailing edge is the chord. The camber line
is midway between the upper surface and the lower surfaces. The distance between
the chord and the mean camber line is the camber. The angle between
the free stream and the chord line is called the angle of attack.
 |
 |
|
| Figure
1 – Dimensions of foil |
The hydrodynamic force
that points in the direction of the free stream is defined as the drag
force, while the component normal to the free stream in the upward direction
is the lift force. The lift and drag forces vary with the angle of
attack. These forces are esxpressed nondimensionally
by defining the coefficients of lift and drag with respect to the planform
area A.
Consider a stationary wing in the middle of a wind tunnel; air flows past it from left to right. Assume that viscosity is small but not zero, the airflow is not significantly turbulent and no fluid can flow through the surface of the wing.
Upstream of the wing (near the left edge of the figure) is a number of smoke injectors. Seven of them are on all the time, injecting thin streams of purple smoke. The smoke is carried past the wing by the air flow, making visible streamlines.
In addition, on a five-times closer vertical spacing, pulsed streamers are injected. The smoke is turned on for 10 milliseconds out of every 20. In the figure, the blue smoke was injected starting 70 milliseconds ago, the green smoke was injected starting 50 milliseconds ago, and so on.
Figure 2 - Flow Past a Wing
Notice that the air just ahead of the wing is moving not
just left to right but also upward. Similarly, the air just aft of the wing is
moving not just left to right but also downward Downwash behind the wing is
relatively easy to understand; the whole purpose of the wing is to impart some
downward motion to the air (Why? To create “lift” on the wing as a reaction
force).
The upwash in front of the wing is a bit more interesting. Air is a fluid,
which means it can exert pressure on itself as well as other things. The air
pressure strongly affects the air, even the air well in front of the wing.
Along the leading edge of the wing there is a stagnation point. On an
airplane, the stagnation line runs the length of the wingspan, but since figure
2 shows only a cross section of the wing, all we see of the stagnation line
is a single point. Another stagnation point exists on the trailing edge. It
marks the place where air that passed above the wing rejoins air that passed
below the wing. It is called stagnation point because the air velocity at that
point is zero; the air is “stagnant” there.
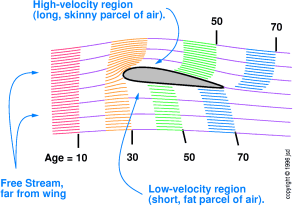
Figure 3 - Velocity Field of a Wing
Figure 3 introduces some additional useful concepts. Since the air
near the wing is flowing at all sorts of different speeds and directions,
the question arises of what is the ``true'' airspeed in the wind tunnel. The
logical thing to do is to measure the velocity of the free stream before it has been disturbed
by the wing.
The pulsed streamers give us a lot of information. Regions where the pulsed
streamers have been stretched out are high velocity regions. Conversely, regions
where the pulsed streamers cover a small distance in 10 milliseconds must
be low-velocity regions. The minimum velocity is zero. That occurs near the
front and rear stagnation points.
Another thing that should be noticed is that in low velocity regions, the
streamlines are farther apart from each other (conservation of mass).
At reasonable airspeeds, the wing doesn't push or pull on the air hard enough
to change its density. The long, thin parcels of air flowing past a particular
point show a region of high velocity and the short wider parcels flowing by
show regions of low velocity.
The most remarkable thing about this figure is that the blue smoke that passed
slightly above the wing got to the trailing edge 10 or 15 milliseconds earlier
than the corresponding smoke that passed slightly below the wing. If this
were not true, it would be impossible for the wing to produce lift. This is
because a difference in the fluid velocity on the upper and lower wing surface
means a difference of pressure also; this pressure difference produces lift.
A delay of particles is not forbidden. Consider the scenario depicted in figure
4.
Figure 4: Delay is Not Forbidden
A river of water is flowing left to right. Using a piece of garden
hose, siphon some water out of the river, let it waste some time going through
several feet of coiled-up hose, and then return it to the river. The water that
went through the hose will be delayed. The delayed parcel of water will never
catch up with its former neighbors; it will not even try to catch up. Note that
delaying the water did not require compressing the water, nor did it require
friction(assuming the hose was frictionless on the inside).
The same story applies to air. Air flowing past an obstacle will be delayed. In
fact, air that comes arbitrarily close to a stagnation line(or point if looking
at a cross-section) will be delayed an arbitrarily long time. The air molecules
just hang around in the vicinity of the stagnation line. This delay occurs even
when the wing is producing zero lift, as shown in the top panel of figure 5.
You can see that in all cases the air that hit the stagnation line dead-on —
the middle blue streamer — never makes it to the trailing edge in any of these
figures. So velocity magnitude can change along a streamline.
When a wing is not producing lift it is just a slight obstacle to the airflow.
Air passing near the wing is slightly delayed, but that's about all. Air that
passed slightly above the wing is delayed about the same amount as the
corresponding air that passed below the wing. When the wing is producing lift,
the airflow patterns become much more interesting.
Figure 5 - Airflow at Various Angles
of Attack
Air that passes above the wing reaches the trailing edge substantially earlier
than it would have if the wing had not been producing lift. Air that passes
below the wing is substantially delayed. These effects extend for quite a
distance above and below the wing.
A wing (when it is producing lift) is amazingly effective at speeding up the
air above it. Even though the air that passes above the wing has a longer path,
it gets to the back earlier than the corresponding air that passes
below the wing.
The change in speed is only temporary. As the air reaches the trailing edge and
thereafter, it quickly returns to its original, free-stream velocity.
Pressure Patterns Near a Wing
Figure 6 is a contour plot that shows what the pressure is doing in the vicinity of the wing. All pressures will be measured relative to the ambient atmospheric pressure in the free stream. The blue-shaded regions indicate suction, i.e. negative pressure relative to ambient, while the red-shaded regions indicate positive pressure relative to ambient. The dividing line between pressure and suction is also indicated in the figure.
Figure 6: Pressure Near a Wing
The maximum positive pressure on the foil occurs right at the stagnation points. The maximum suction depends on the angle of attack and on the detailed shape of the airfoil.
It is clear that the front quarter or so of the wing does
half of the lifting. Another thing to notice is that suction acting on the top
of the wing is vastly more important than pressure acting on the bottom of the
wing. In figure 6 the wing is flying at an angle of attack of 3 degrees,
a reasonable ``cruise'' value.
At this angle of attack, there is almost no high pressure on the bottom of the
wing; indeed there is mostly suction there. The only reason the wing
can support the weight of the airplane is that there is more suction
on the top of the wing.
At higher angles of attack, above-atmospheric pressure does develop below the
wing, but it is always less pronounced than the below-atmospheric pressure
above the wing.
Stream Line Curvature
Figure 7 shows what happens near the wing when we change the angle of attack. You can see that as the velocity changes, the pressure changes also.
Figure 7 - Airflow and Pressure Near
Wings
It turns out that given the velocity field, it is rather straightforward to
calculate the pressure field. From Bernoulli’s equation, it is clear that as
the velocity increases, the pressure decreases.
Cambered Foils
Figure 8 - Airfoil Terminology
The maximum difference between the mean camber line and the chord line is the amount of camber. A symmetric foil has zero camber. The airflow and pressure patterns for such an airfoil are shown in figure 9.
Figure 9 - Symmetric Airfoil
At small angles of attack, a symmetric airfoil works better than a highly cambered airfoil. Conversely, at high angles of attack, a cambered airfoil works better than the corresponding symmetric airfoil. If the angle of attack is too large, stall occurs; i.e. the lift coefficient rapidly decreases. The existence of a smooth leading edge allows for a slightly larger angle of attack before stall and separation of the flow occur.
An example of this is shown in figure 10. The airfoil designated ``631-012'' is symmetric, while the airfoil designated ``631-412'' airfoil is cambered; otherwise the two are identical. At any normal angle of attack (up to about 12 degrees), the two airfoils produce virtually identical amounts of lift. Beyond that point the cambered airfoil has a big advantage because it does not stall until a much higher relative angle of attack. As a consequence, its maximum coefficient of lift is much greater.
Figure 10 - Camber Fends Off The Stall
At high angles of attack, the leading edge of a cambered wing will slice into
the wind at less of an angle compared to the corresponding symmetric wing. This
doesn't prove anything, but it provides an intuitive feeling for why the
cambered wing has more resistance to stalling.
The amount of camber on a typical modern airfoil is only 1 or 2 percent —
obviously not crucial. One reason wings are not more cambered is that any
increase would require the bottom surface to be concave — which would be a pain
to manufacture. Another reason is that large camber is only really beneficial
near the stall and it suffices to create lots of camber by extending flaps when
needed. Reverse camber is clearly a bad idea (since it causes earlier stall) so
aircraft that are expected to perform well upside-down have symmetric airfoils.
We have seen that under ordinary conditions, the amount of lift produced by a
wing depends on the angle of attack, but hardly depends at all on the amount of
camber. This makes sense. In fact, an airplane would be unflyable if the
coefficient of lift were determined solely by the shape of the wing. Since the
amount of camber doesn't often change in flight, there would be no way to
change the coefficient of lift. In reality, the pilot (and the trim system)
continually regulate the amount of lift by regulating the all-important angle
of attack.
Thin-wing Theory
The wing used on the Wright
brothers' first airplane is thin, highly cambered, and quite concave on the
bottom. This is shown in figure 11. There is no significant difference
between the top surface and the bottom surface — same length, same curvature.
Still, the wing produces lift, using the same lift-producing principle as any
other airfoil
Similar remarks apply to the sail of a sailboat. It is a very thin wing,
oriented more-or-less vertically, producing sideways lift.
Figure 11 - The Wrights' 1903 Airfoil
Even a thin flat object such as a barn door will produce lift, if the wind
strikes it at an appropriate angle of attack. The airflow pattern (somewhat
idealized) for a barn door (or the wing on a dime-store balsa glider) is shown
in figure 12. Once again, the lift-producing mechanism is the same.
Figure 12 - Barn Door — Natural
Airflow
Circulation
You may be wondering whether the flow patterns shown in figure 12 or the earlier figures are the only ones allowed by the laws of hydrodynamics. The answer is: almost, but not quite. Figure 13 shows the barn door operating with the same angle of attack (and the same airspeed) as in figure 12, but the airflow pattern is different.
Figure 13 - Barn Door — Unnatural
Stream Lines
The new airflow pattern is highly symmetric. The front stagnation line is a certain distance behind the leading edge; the rear stagnation line is the same distance ahead of the trailing edge. This airflow pattern produces no lift. The difference between figure 12 and figure 13 is circulation —figure 12 has circulation while figure 13 does not.
To understand circulation and its effects, first imagine an airplane with barn-door wings, parked on the ramp on a day with no wind. Then imagine stirring the air with a paddle, setting up a circulatory flow pattern, flowing nose-to-tail over the top of the wing and tail-to-nose under the bottom (clockwise in this figure). This is the flow pattern for pure circulation, as shown in figure 14.
Figure 14 - Barn Door — Pure Circulation
Then imagine that a headwind springs up (left to right in
the figure). At each point in space, the velocity fields will add. The
circulatory flow and the wind will add above the wing, producing high
velocity and low pressure there. The circulatory flow will partially cancel
the wind below the wing, producing low velocity and high pressure there.
Figure 15 - Barn Door — Natural
Stream Lines
If we take the noncirculatory
left-to-right flow in figure 13 and add various amounts of circulation,
we can generate all the flow patterns consistent with the laws of
hydrodynamics — including the actual natural airflow shown in figure 12
and figure 15.
There is nothing special about barn doors; real foils have analogous airflow patterns, as shown in figure 16, figure 17, and figure 18.
|
|
|
|
Figure 16 - Unnatural Airflow — Angle of Attack but No Circulation |
Figure 17 - Pure Circulation |
Figure 18 - Normal, Natural Airflow
How Much Circulation? The Kutta Condition
In real flight situations,
precisely enough circulation will be established so that the rear stagnation
point is right at the trailing edge, so no air needs to turn the corner there.
Of course, the circulation that cancels the flow around the trailing edge more
or less doubles the flow around the leading edge.
The general rule - called the Kutta condition - is that the fluid must
have a finite velocity at the sharp trailing edge. In potential flow theory,
the velocity at the trailing edge is infinite. In reality, viscosity at the
boundary layer and the starting vortex at the sharp edge play an important role
in maintaining a finite velocity at that trailing edge.
As the angle of attack increases, the amount of circulation
needed to meet the Kutta condition increases. Here is a direct way of
demonstrating the Kutta condition: At a safe altitude, start with the airplane
in the clean configuration in level flight, a couple of knots above the speed
where the stall warning horn comes on. Maintaining constant pitch attitude and
maintaining level flight, extend the flaps. The stall warning horn will come
on. There is no need to stall the airplane; the warning horn itself makes the
point.
This demonstration makes it clear that the flap (which is at the back of the
wing) is having a big effect on the airflow around the entire wing, including
the stall-warning detector (which is near the front). Extending the flaps
(while maintaining constant pitch and constant direction of flight) increases
the angle of attack. This increases the circulation, which trips the
stall-warning detector.
How Much Lift? The Kutta-Joukowsky Theorem
The Kutta-Joukowsky theorem states that lift force is equal to the airspeed times the circulation timesthe density for a 2D wing.
![]()
Since circulation is proportional to the coefficient of lift
and to the airspeed, this new notion is consistent with our previous knowledge
that the lift should be proportional to the coefficient of lift times airspeed
squared.
You can look at a velocity field and visualize the circulation. In figure 19,
the vertical black line shows where the 70 millisecond timeline would have been
if the wing had been completely absent. The actual 70 millisecond timeline is
given by the right-hand edge of the blue streamers.
Figure 19 - Circulation Advances Upper
& Retards Lower Streamers
Because of the circulatory contribution to the velocity, the
streamers above the wing are at a relatively advanced position, while the
streamers below the wing are at a relatively retarded position. If you refer
back to figure 7, you can see that circulation is proportional to angle
of attack. In particular, note that when the airfoil is not producing lift
there is no circulation — the upper streamers are not advanced relative to the
lower streamers.
The same thing can be seen by comparing figure 16 to figure 18 —
when there is no circulation the upper streamers are not advanced relative to
the lower streamers.
Lift Requires Circulation and Vortices
The circulation necessary to
produce lift can be attributed to a bound vortex line. It binds to the
wing and travels with the airplane. The question arises, what happens to this
vortex line at the wingtips?
The answer is that the vortex spills off each wingtip. Each wing forms a trailing
vortex (also called wake vortex) that extends for miles behind
the airplane. These trailing vortices constitute the continuation of the bound
vortex. See figure 20. Far behind the airplane, possibly all the way
back at the place where the plane left ground effect, the two trailing vortices
join up to form an unbroken vortex line.
Figure 20 - Bound Vortex, Trailing
Vortices
The air rotates around the vortex line in the direction indicated in the
figure. We know that the airplane, in order to support its weight, has to yank
down on the air. The air that has been visited by the airplane will have a
descending motion relative to the rest of the air. The trailing vortices mark
the boundary of this region of descending air.
It doesn't matter whether you consider the vorticity to be the cause or the
effect of the descending air - you can't have one without the other.
Lift must equal weight times load factor, and we can't easily change the
weight, or the air density, or the wingspan. Therefore, when the airplane flies
at a low airspeed, it must generate lots of circulation.
REFERENCES
1- Fluid Mechanics with Engineering Applications - Daugherty
2- A first course in fluid dynamics - Patterson
3- Fluid Mechanics for Engineers - P.S. Bana 1969
4- Fluid Mechanics: A Laboratory Course - Plint/Boswirth
5- Marine Hydrodynamics, J. N. Newman
6- Airfoils and Airflow, Copyright © 1996-2001 jsd http://www.monmouth.com/~jsd/how/htm/airfoils.html
7- Physical Fluid Dynamics, D. J. Tritton