Moving phosphors on the screen –
now I understand
“It has a dynamic plot – literally!”
Convolution Haiku:
Lines blue, red, and green
Moving phosphors on the screen –
now I understand
On this page, we show the convolution of two exponential signals. The signals are shown in this plot; the convolution operation is shown in this movie. You can read an explanation of what's happening here.
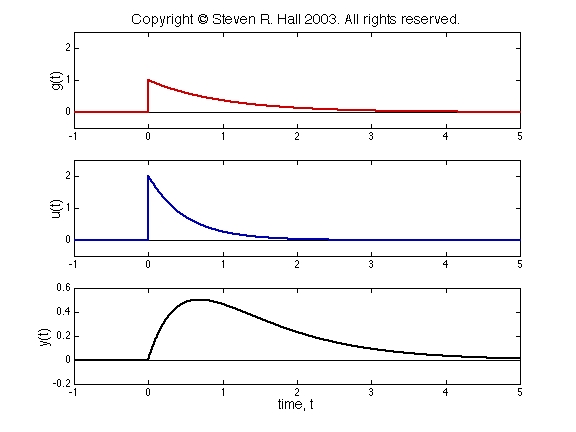
In the movie above, there are three dynamic plots. In the upper plot, u(t) is shown in blue, and g(t-τ) is shown in red. As t increases, the curve g(t-τ) slides to the right. In the middle plot, the product g(t-τ)u(τ) is shown in green. So the convolution y(t)=g(t)*u(t) at time t is equal to the area under the green. As t increases, the convolution is plotted out in the bottom plot as the black curve.