Table of Contents
Abstract
1. Introduction
2. Experimental Procedure
Using Equations
Understanding Paraphrasing
and Plagiarism
3. Results and Discussion
Using Figures and Tables
4. Conclusions
(and Recommendations)
Abstract
What is an abstract? Readers typically decide whether or not to read a paper based on their impressions of the abstract. Consequently, the abstract can be the most important part of your report. A good abstract summarizes the complete report content, including at least one sentence per section: purpose, technical approach, results, and conclusion. In other words, what did you find (give numerical results of your measurements, including numerical uncertainty estimates), and what do your results mean (do they agree with theory? with other measurements?). The Abstract does not lead in to your Introduction – it is a stand-alone section of text.
Format: The abstract for your 2.671 Journal Article should be a single paragraph of about 150 words, a typical length. (You may use the Word Count tool in the Tools menu in MS Word to count the words in your abstract.) Typically the Abstract is placed on its own page, before the first page of the report. In the interest of saving paper, however, the 2.671 Journal Article Introduction can immediately follow the Abstract on the same page (numbered 1).
Tip: Because writers consider the abstract the most difficult and important piece of their papers, abstracts are always written AFTER you have written your ENTIRE report. Save time at the end of your process to write a credible abstract. Check out the Abstract Worksheet on the 2.671 website for a step-by-step method for writing your abstract (filling out this worksheet will be required for future abstract writing assignments).
Pitfalls to avoid: Wordiness, providing too much or too little motivation for your project (ask technical instructors if you are unsure), and failure to include a relevant conclusion. Poor abstracts contain abbreviations, chemical formulas, jargon, or references to the literature, tables, or figures. Poor abstracts contain claims that do not to correspond to findings in the report itself.
Return to Table of Contents
1. Introduction
(use style “Heading 1” as your format for section headings)
What is an introduction? The Introduction of your report is organized as a funnel that begins with a definition of why the experiment is being performed and ends with a specific statement of your research approach. In published journal articles, there are at least two citations required in the introduction that support the need for your research and experiments, or show upon which theories your experiment relies. Make sure to include at least two citations in your 2.671 reports (not required for the Soda Can lab paper).
A non-technical reader must understand the Introduction, including the technical goals and objectives, the main technical issues, any applications in the real world (as appropriate). Provide context, any background required to understand the experiment. Explain the motivation for the project (as necessary), and provide a focus, a clear, one sentence purpose statement.
Format: The length of the Introduction should typically be about ½ page (1-3 paragraphs).
Tip: In general the more complex an experiment, the more background required (even to the point of including a separate background section, as seen in some of the sample articles on the 2.671 website). The experiments performed in 2.671, however, limit the scope of background material required in your Journal Articles.
Pitfalls to avoid: Including unnecessary background or being repetitive. Exaggerating (or understating) the importance of your work. Using lackluster openers and weak follow-through in the body of your introduction.
Return to Table of Contents
2. Experimental Procedure
What is the Experimental Procedure section? The Experimental Procedure section is typically divided into several subheadings, each of which corresponds to the major intellectual steps you took to complete the experiment (e.g. “Measuring Strain” or “Determining Velocity”). Note that the heading for this section should not be called “Experimental Procedure” – a heading title specific to your experiment is preferred, such as “New Design for Particle Beam Fusion” in the example in Table 1. The subheadings must describe specific aspects of the experimental procedure, as shown in the example below..
Table 1: A comparison of headings for the same report. Note that the same information is included in both columns, but that the right column is much easier to understand. The Experimental Procedure section is called New Design for Particle Beam Fusion.
|
Non-Parallel and Non-Descriptive
(Weak) |
Parallel and Descriptive (Strong) |
|
Introduction Background Marx Generators Line Pulse Beam Generation Transporting Beam Pellets Results Conclusions |
Introduction Past Designs for Particle Beam Fusion New Design for Particle Beam Fusion Charging Marx Generators Forming Line Pulse Generating Particle Beam Transporting Particle Beam Irradiating Tritium Pellets Results of New Design Conclusions and Recommendations |
Note which report headings make it easier for readers to understand the report content.
Format: It is not necessary to have text in the space between the section heading and the first subsection heading. However, if you feel text before the subheading makes the document more readable, we suggest that you have at least one short paragraph of several sentences (in other words, don’t put just one sentence between the section heading and first subheading).
Tip: Because headings and subheadings vary according to each experiment, the guidelines for this section of your report cover solely the few pieces that appear in every journal article. DO NOT label these subsections as “Apparatus” and “Method”—instead assign unique subheadings that correspond to your intellectual and technical approach and incorporate the description of apparatus and your methods into each subheading.
Pitfalls to avoid: Providing too little or too much information. Writing strictly in chronological order (alternatives: most important steps first, most fundamental steps first, etc.). Methods and results don’t correspond (provide methods for all the results you report). Forgetting to use visual organizers to direct readers to specific aspects of the methods section, e.g., subheads, photos of apparatus, etc. Failing to provide a mini-context for the methods themselves, how you achieved your calculations:
“[In order] to . . . , we . . . “ Ü context for method.
Describing the Apparatus (use Heading 2 for subheadings)
What is the apparatus? The experimental procedure section includes a description of the apparatus. A block diagram and/or photograph of the apparatus must be included. Write your description of the apparatus in present tense, since presumably the apparatus still exists!
Format: If a photograph is used, important elements of the apparatus must be clearly labeled. Do not over-label your photograph; some of the labels used on photographs in the lab instructions are much too detailed for inclusion in a Journal Article. In many cases, the clearest approach will be to present a block diagram enhanced by one or more photographs of the apparatus in the same figure. An example of this type of apparatus figure is presented in Fig. 1.
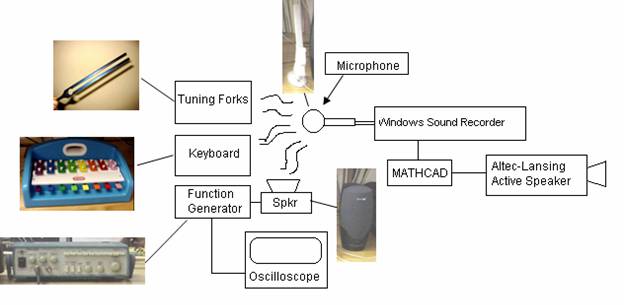
Figure 1: Experimental apparatus for performing
sound analysis experiments. The function of each part of the apparatus shown is
described in the text. (Note: Figure captions contain enough information to
let readers to skim the paper by looking at the figures, or should make it
clear that the missing information can be found in the text.)
Notice the reference to the figure in the text preceding the
figure (highlighted
here for emphasis). The paragraph following the figure (this paragraph)
describes the apparatus, referring to the figure for clarity. Ideally, the
description and the figure should be on the same page so that the reader can
follow your description while looking at the figure.
Tip: Block diagrams can be generated using the
drawing toolbar in Word: select text boxes, shapes, arrows, etc. You can also
obtain Microsoft Visio, a diagramming program, at minimal cost through MIT’s
agreement with GovConnection (http://web.mit.edu/ist/products/vsls/ms-select.html).
Pitfalls to avoid: Manage your level of detail
appropriately; many unsuccessful apparatus descriptions contain too much or too
little detail. The description of the apparatus includes the manufacturer and
model number, but not serial number (that belongs in your lab
notebook, not your report) for each instrument. A description of the instrument
accuracy as specified in the instrument manual (found in your lab bench drawer)
is appropriate for this section.
Describing your Methods
What are Methods? Methods are descriptions of the important steps of the experimental approach: these subsections describe what you did and consequently are written in past tense. Your approach is organized by intellectual topic, in contrast to the lab instructions, where the methods are explained chronologically. Use relevant headings and subheadings to orient your reader to your approach.
For a Journal Article, you should provide enough detail for the reader to be able to repeat your experiment, but be sure to include only the most important steps, as you can assume your reader is familiar with the methods used in your field of research. For example, for the Soda Can report, the following text is too detailed:
We sanded the
diet Pepsi can lightly with 200 grit sandpaper and then brushed off the dirt.
We then used tweezers to put the strain gauge shiny side up on the lab bench
and picked it up with a piece of special clear tape. We folded under a small
section of tape … etc.
Instead, simplified text describes more clearly what you did:
A strain gauge
was attached to the diet Pepsi can with M-bond 200 adhesive, after the can was
lightly sanded, to promote adhesion of the gauge to the can.
Format: Write this section as paragraph text, not as numbered or bulleted lists from the lab instructions.
Tip: The procedure used to calibrate your instruments (full-wave bridge, load cell, hot-wire anemometer, etc.) belongs in the Experimental Procedure section. The results of your calibration experiments also belong in this section. Calibration of instruments is extremely important, but is not considered an experimental result – rather, it is a necessary step to be performed before taking measurements, and therefore does not belong in the Results and Discussion section. Errors in calibration directly affect your experimental uncertainty, and thus should be discussed here.
Pitfalls to avoid: Do not title a subsection in your
report called “Calibration of Instruments” Instead, discuss the calibration
results for each instrument when you discuss the method of calibration for that
particular instrument. Make sure subheadings are descriptive and organized into
groups.
Return to Table of Contents
Using Equations
What are equations? Equations can appear in the Experimental Procedure question if they are relevant to understanding the steps you took to achieve your results. Equations may also appear in the Results and Discussion section when you address the impact of theory on your experiment.
Format: Follow the format used in the lab instructions. Use Equation Editor (in Microsoft Word) to create professional quality equations. If you do not use Word, you must still create professional quality equations. (If you do not have Equation Editor installed on your computer, please contact the lab manager.) Number every equation sequentially throughout the body of the report, and make numbers appear on the right-hand margin. Italicize all variables, both in the equation itself and when referred to in the text. Define all variables in the equation immediately after the equation is presented in the text, unless it would enhance the clarity and flow of the report to define a variable in the text before the equation.
Use the consistent set of MKS units for all work performed in 2.671. It is not necessary to define the units of variables used in equations as long as the description clearly indicates the type of quantity represented by the variable. For example, the statement “where d is the diameter of the pipe” clearly indicates that d represents a length variable, and thus has units of meters (m).
Although equations are set off from the text in a paragraph, punctuate them with commas and periods as if they were words.
Tip: In some cases, the
derivation of an equation can be made clearer by including a schematic or drawing
in the text. The following text, adapted from the instructions for Lab 3,
“Estimation of Internal Pressure within an Aluminum Soda Can”, demonstrates the
proper use of equations, including the appropriate level of derivation for a
Journal Article:
In order to calculate the change in strain resulting from opening the soda can from the measured output voltage of the strain gauge circuit, the dependence of circuit output voltage on resistance change must be determined. This dependence can be derived using the resistive divider (or half-wave bridge) circuit shown in Fig. 2.

![]()
![]()
![]()
Figure 2: Half-wave bridge circuit, or resistive
divider, used to determine the change in resistance caused by changing the
strain on the strain gauge.1
The output voltage Vout is
 , (1)
, (1)
where V0 is the voltage
supplied to the bridge and R1 and R2
are resistances. (Follow the hyperlink at
the beginning of this line for an important comment.)
If the bridge has been
balanced by setting![]() , it is easy to show that
, it is easy to show that![]() .
.
In the case under discussion, R2 represents
a strain gauge attached to an unopened soda can. Opening the can causes a
change in strain which results in a change in resistance, DR. For![]() , straightforward application of Ohm’s Law to the circuit
shown in Fig. 1 yields
, straightforward application of Ohm’s Law to the circuit
shown in Fig. 1 yields
 , (2)
, (2)
where DV is the change in output voltage from the balanced value.
Pitfalls to avoid: Follow the three links above for comments. Avoid incorrect punctuation of equations.
Comments: (Hyperlinked to locations in the document above)
Comment 1: Note the lack of indentation, since this text is
simply the completion of the sentence and is not a new paragraph. Also note the
comma after the equation and the fact that all variables listed in Eq. (1) have
been defined either before the equation or in the phrase immediately following
the equation.) Return.
Comment 2: Note that simple equations can be inserted directly
into a paragraph and need not be numbered, as long as they are not referred to
later in the text. Equations in text must fit in one line, so formatting the
second equation as ![]() in text is not acceptable.) Return.
in text is not acceptable.) Return.
Comment 3: Do not re-define variables that were previously
defined. Note how the writer describes the equation, how the derivation was
performed and how she removed the intermediate steps shown in the lab instructions..
Return to Table of Contents
Understanding Paraphrasing and Plagiarism
What is the difference between paraphrasing and plagiarism? Former 2.671 students have commented on the difficulty of writing their reports without copying lab instructions. The “Using Equations” document shows an acceptable way to paraphrase the lab instructions. The most important points to notice about paraphrasing are: (1) the source of the ideas is clearly referenced, and (2) the text is not identical to (and not just slightly modified from) that in the source document.
The Mayfield Handbook of Technical and Scientific Writing,
an MIT resource for technical writing, defines plagiarism as follows:2
[Plagiarism] is the copying, whether deliberate or unintentional, of ideas or portions of text without citing the sources for credit. It is also the use of other people's ideas without attributing them to the proper source. Although plagiarism is often unintentional, it still demonstrates incompetence. If you fail to record your sources and then later forget that you used a source, you are still liable and open to the charge of theft of intellectual property.
The Mayfield Handbook further states that “All ideas and information taken from a source must be acknowledged unless they are considered common knowledge”.2 Ideas and information includes pictures or diagrams taken from other documents or web sites, as well as all ideas that did not originate with you.
Format: Follow AIP format for citing sources.
Tip: The fact that you have seen the same idea on several websites does not imply that it is “common knowledge”. Common knowledge refers to basic concepts that should be known by anyone with a similar general education as you (for example, Course 2 students who have not taken 2.671). Such universally known concepts include Ohm’s law, the definitions of stress and strain, Newton’s laws of motion, and other basic concepts you have learned in previous courses.
Pitfalls to avoid: It is never acceptable for you to use 2.671 reports by other students (including your lab partner) as sources when writing your own 2.671 report. The experiments do change from semester to semester, and it has been apparent to us when material from previous years has been recycled. Besides, the point of writing 2.671 reports is for you to learn how to effectively communicate your own work, which can’t be learned by copying someone else’s report.
Return to Table of Contents
3. Results and Discussion
What are Results and Discussion? This section is the most intellectually important part of your paper. When presenting your data, think first about your results, and what those data mean. When presenting your data, remember to only use figures to illustrate your most important points (no padding!), and to match figures appropriately to your data set. Results are written in the past tense; discussion points are often addressed in the present tense—a simple rule is to use past tense whenever describing past experimental action.
Present numerical values for uncertainty in the
Results and Discussion section, so that each numerical result (such as the
pressure inside an unopened soda can) is presented with an uncertainty
estimate. For example, “The pressure inside the diet Pepsi can before opening
was found to be 335 ±
15 kPa.” The derivation of experimental uncertainty, while time consuming,
should not be discussed in detail in your report. The approach should be
summarized in a sentence or two, i.e. “quoted uncertainties represent the 95%
confidence interval computed with the t-statistic approach from the
measurements”.
Once you’ve summarized your key data points, you can analyze your findings. This “discussion” requires the most of you as a writer: you can really show your personal intellectual take on why your experiment ended up the way it did. Give your opinions (without using “I”) on the meaning of your data by comparison with a theoretical model and/or with other experimental results (for example, compare your measured soda can pressure with that found by other students in the class). Did the experimental values match the theoretical values? When comparing your data to theory or other measurements, make quantitative (i.e. numerical), not just qualitative, statements about the agreement. For example, rather than stating “our data agreed well with theory”, state that “our measured sound velocity was 5% higher than the theoretical result. This finding is less than the 7% uncertainty in our measured value, and thus the agreement with theory is within the 95% confidence interval for our measurements.”
The Results and Discussion section is also the appropriate place to discuss any problems or limitations you encountered while performing the experiment, and how those problems affected the uncertainty in your experimental results (be quantitative!). However, please do not emphasize problems with your experiment. For example, suppose the first time you tried the experiment you made a mistake and had to repeat the experiment to get the required data. Since you do not present any data from the first run of the experiment, you should not even mention the failed experiment in your lab report. When presenting the results of your work, emphasize the positive, not the negative!.
Format: Follow tips in the “Using Figures and Tables” handout. Begin the section with your relevant data, remind readers of your experimental goals, and then analyze your results. The experimental uncertainty probably does not need to be presented in a separate subsection. In most cases it is clearer to present the uncertainty with the results of each type of experiment.
Tip: Note that your data may disagree with the theory due to problems with the theory, not your measurements! This concept also applies when comparing measurements to manufacturers’ specification sheets – what were the conditions under which they measured the specifications? Are they identical to yours? Did they account for the item to item variability in their product? What about the effect of wear on the specifications? Analyze all possibilities.
Pitfalls to avoid: Overstating the results (e.g., “Figure 1 clearly shows…” and “Obviously…”). Reporting irrelevant results; remind readers and of your project focus and stick to it. Failing to include and explain unexpected outcomes, error, and uncertainty. Speculating too much or not enough—back it up with literature or legitimate observation. Hedging excessively (e.g. “The causes of discrepancies between literature and results is unknown, but could possibly be caused by a presumable error in calibration, either human or wear-induced”).
Return to Table of Contents
Using Figures and Tables
When readers skim a paper,
illustrations stand out. Consequently, good writers use illustrations only to
emphasize their main points (i.e. they don’t pad their report with extra
figures and unnecessary tables). When presenting an illustration, make sure to
introduce it in the text immediately preceding the figure (or table). The
paragraph above and/or below each figure (or table) explains what the
illustration is. Sometimes it is convenient to discuss the main point of the
figure in the paragraph above and the details of what is shown in the paragraph
below.
Tip: You may use any plotting program you like to
generate figures. An example of a good figure is shown in Fig. 3.
Figure 3: Measured and calculated efficiency for Motor 3. The points represent measured efficiency for motor voltage of 4 V (green), 8 V (red), and 12 V (blue). The solid curves are the calculated efficiency for the model parameters determined as described above: Ra = 2.93 W, T0 = 0.25 mN-m, and Ke = 11 mrad/Vs.
While your figures do not have to be identical in format to that shown above, there are many aspects of this figure that you should emulate. Notice that the calculated curves in Fig. 3 are smooth. Calculations should be performed at as many points as necessary to obtain a smooth curve (if a smooth curve is predicted by theory). In other words, do not only perform calculations at the same value of independent variable (angular frequency in the case shown above) as used for your data points. Also note that the units of measurement appear on the appropriate axis, and that the figure is enclosed on all sides (no open white space). Scribe marks are also clear and consistently sized. Make sure to use a legend as well to define color or shape differentiations.
Format: Figure 3 was generated with Excel. Use “Format Chart Area” to set the Border to None and the Area to White before copying the figure into Word.
Figures and tables must both have
captions. Figure captions are placed immediately below the figure to which they
refer, while table captions are placed immediately above the table. Use the
styles “Figure Caption” and “Table Caption” for all captions. Notice that the font is 1 point smaller to
set the caption off from the body text and the caption is fully justified and
indented by 0.5″ on left and right. Small captions should be centered on
the page; multi-line captions should use the fully justified and indented style
described above It is good practice to keep the figure on the same page as the
text referring to it, even if it means leaving a white space on the page
preceding the figure. Proof your final copy to make sure that all captions
are on the same page as the figure or table to which they refer. Pagination
in Word changes when you change the printer driver, so if you edited your
document using one printer, and then print your final copy in the 2.671 lab,
you may find some awkward page breaks. Take the time to check the formatting
before you turn it in!
Table 2 covers the guidelines for 2.671 plots in reports. It is more important that your figure clearly demonstrate the important point(s) you will discuss than that the formatting is exactly as shown in Fig. 3. The guidelines presented in Table 2 are to help you produce clean, easily interpreted figures to aid your discussion.
Table 2: Guidelines for plots in 2.671 reports
|
Parameter |
Format |
|
Data
points |
Colored
points, not connected by lines |
|
Theory
or Fit to data |
Lines |
|
Axes:
tick marks |
Either
all inside or all outside the axis |
|
Axes:
numbers |
Use the
appropriate number of decimal points (none for integers) |
|
Axes:
labels |
Label
with the variable name followed by units in either () or []. Note: Make
sure to select “Hide Arguments” in MathCAD plots so that only the axis labels
are visible. |
|
Title |
No
title! Put the description in the figure caption instead |
|
Linear fit
coefficient |
In
caption, not on the figure (different from Excel default) |
|
Plot
background |
White (remove the default gray background from Excel) |
|
Gridlines |
Generally
not (different from Excel default) unless you have a good reason to include
them |
Pitfalls to avoid: A picture is worth a thousand words, but only if that figure is used appropriately. Figure 4 shows an example when text is more appropriate than a figure or table.
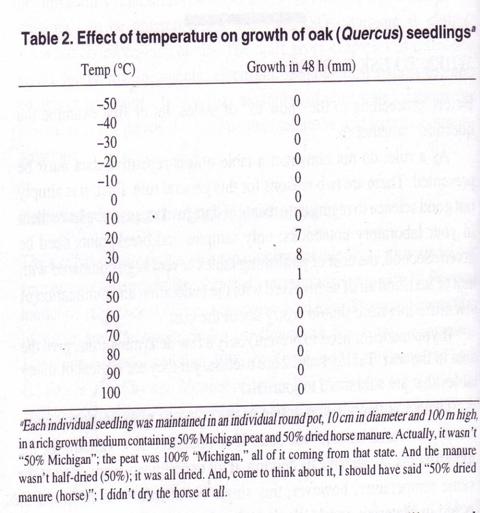
Figure 4: Sample Useless Table. Note the suspicious number of zeros. (Watch also for repetitive 100s when expressing percents).
In the words of scholar R.A. Day, “When a table or column can readily be put into words, do it.” This table takes up a lot of space and does not say much. Instead, the following sentence best summarizes the data: The oak seedlings grew at temperatures between 20 and 40’C; no measurable growth occurred at temperatures below 20’ C or above 40’C.
Return to Table of Contents
4. Conclusions (and Recommendations)
What is a conclusion? In a conclusion, you summarize your findings and explain the implications of your work (including hard numbers with uncertainty estimates). Conclusions contain no new data or findings. You may also include Recommendations for improvements to the apparatus or method, or suggestions for future research on the subject at hand.
Format: Your final paragraph of the Discussion section can serve as your conclusion. You may, however, want to include your conclusion and recommendations for future work in a separate section. This separate section does not exceed 1-2 paragraphs in length.
Tip: If you have recommendations, please also email them to Dr. Barbara Hughey at bhughey@mit.edu so that your suggestions can be considered for incorporation into the 2.671 experiments.
Pitfalls to avoid: Including new data, exceeding 1-2 paragraphs, solely repeating major findings without adding significance or implications to those findings.