
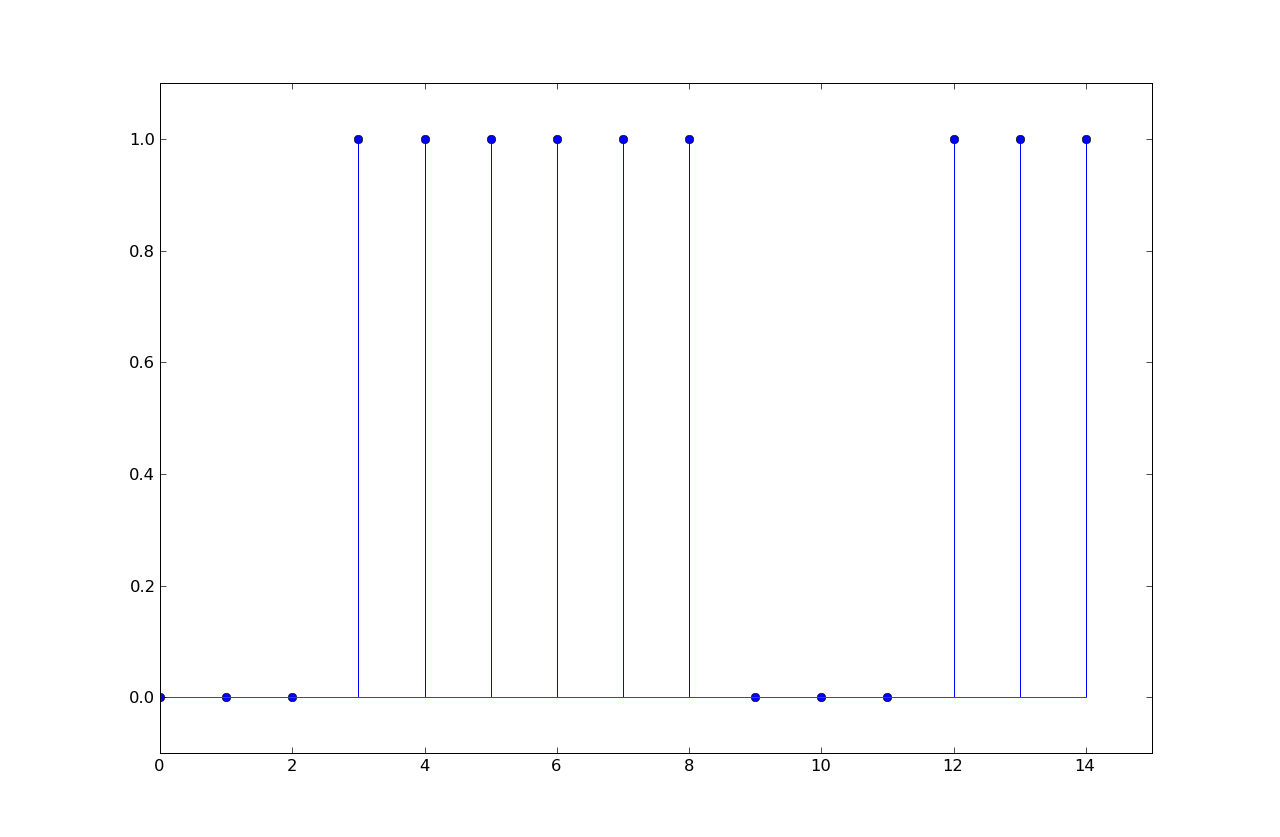
In the following plot of a voltage waveform from a transmitter, the transmitter sends 0 Volts for a zero bit and 1.0 Volts for a one bit, and is sending bits with with a certain number of samples per bit.
The input sequence to a linear time-invariant (LTI) system is given by
and the output of the LTI system is given by

So y = 1, 2, 2, 2, 1, 0, 0, ... when n ≥ 0, 0 otherwise.
Suppose the bit detection sample at the receiver is V + noise volts when the sample corresponds to a transmitted '1', and 0.0 + noise volts when the sample corresponds to a transmitted '0', where noise is a zero-mean Normal(Gaussian) random variable with standard deviation σNOISE.
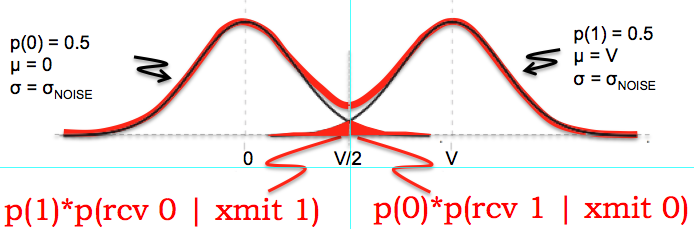
so the bit-error rate is given by
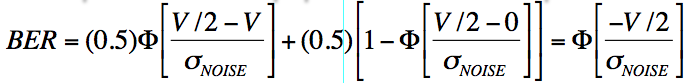
where we've used the fact that Φ[-x] = 1 - Φ[x], i.e., that the unit-normal Gaussian is symmetrical about the 0 mean.
BER = Φ[-0.5/σNOISE] = 1 - Φ[0.5/σNOISE]If we want BER = 0.2 then
BER = 1/5 = 1 - Φ[0.5/σNOISE]which implies
Φ[0.5/σNOISE] = 4/5Using the conveniently supplied fact that Φ(0.85) ≈ 4/5, we can solve for σNOISE
0.5/σNOISE = 0.85 => σNOISE = 0.5/.85 = .588
BER = (0.667)Φ[(V/2 - V)/σNOISE] + (0.333)Φ[(-V/2)/σNOISE]
    = Φ[(-v/2)/σNOISE]
So the derivation of part (B) is the same and the answer for σNOISE is
unchanged. Note that when the transmission probabilities are unequal, the choice of
the digitization threshold to minimize BER would no longer be 0.5V (it would move lower),
but that's not what this question was asking.
Determine the output y[n] for a system with the input x[n] and unit-sample response h[n] shown below. Assume h[n]=0 and x[n]=0 for any times n not shown.
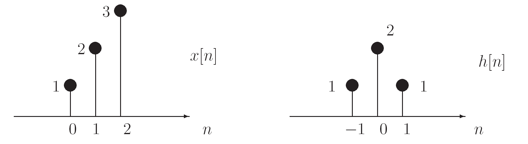
y[n] = Σx[k]h[n-k] = x[0]h[n] + x[1]h[n-1] + x[2]h[n-2]
     = δ[n+1] + 4δ[n] + 8δ[n-1] + 8δ[n-2] + 3δ[n-3]
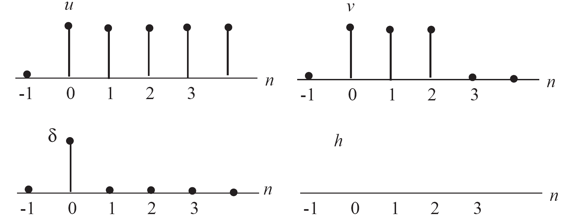
δ[n] = u[n] - u[n-1]
Since the system is linear we can compute the response of the system to
the input δ[n] using the superposition of the appropriately scaled
and shifted v[n]:
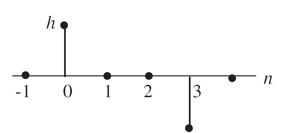
h[n] = v[n] - v[n-1]
The result is shown in the figure below:
 Note that
The following figure show plots of several received waveforms. The transmitter is sending sequences of binary symbols (i.e., either 0 or 1) at some fixed symbol rate, using 0V to represent 0 and 1V to represent 1.The horizontal grid spacing is 1 microsecond (1e-6 sec).
Answer the following questions for each plot:
Ben Bitdiddle is doing a 6.02 lab on understanding the effect of noise on data receptions, and is confused about the following questions. Please help him by answering them.
In these questions, assume that:
The channel has non-zero random noise, but unless stated otherwise, assume that the noise has 0 mean and that it is a Gaussian with finite variance. The noise affects the received samples in an additive manner, as in the labs you've done.
The noise is a function of Φ[(vth - (signal_level + noise_mean))/noise_sigma] multiplied as appropriate by alpha or beta. So the bit error rate clearly depends on the signal level, the mean and variance of the noise and the digitization threshold.
The number of samples per bit doesn't enter directly into the bit error calculation, but more samples per bit gives each transition more time to reach its final value, reducing inter-symbol interference. This means that the eye will be more open. In the presence of noise, a wider eye means a lower bit error rate.
The magnitude of the BER is, of course, a function of the noise variance, but for a given noise variance, if alpha = beta, the minimum BER is achieved by setting the digitization threshold at 0.5. So (e) is false.
As we saw in PSet #3, when alpha ≠ beta, the noise is minimized when the digitization threshold moves away from the more probable signal. Suppose alpha > beta. The digitization threshold would increase so P_01 would get smaller and P_10 larger. So (c) is not true and (d) is true.
BER = 0.5*(1 - Φ[.5/σ]) + 0.5*Φ[-.5/σ]
    = Φ[-.5/σ]
Doubling the noise variance is the same as multiplying σ by sqrt(2), so the resulting BER would be
BERnew = Φ[-.5/(sqrt(2)*σ)]
The change in the bit error rate is given by BERnew - BER.
Problem .
The output of a particular communication channel is given by
y[n] = αx[n] + βx[n-1] where α > β
It's easy to verify both properities given the channel response above, so the channel is linear.
To be time invariant the channel must have the property that if we shift the input by some number of samples s, the output also shifts by s samples. Again that property is easily verified given the channel response above, so the channel is time invariant.
Using the channel response given above, the channel's unit-sample reponse can be computed as
h[0]=α,
h[1]=β,
h[n]=0 for all other values of n
x[n] = [1, 0, 0, 1, 1, 0, 1, 1], followed by all 1's.
then what is the channel's output assuming α=.7 and
β=.3?
Convolving x[n] with h[n] we get
y[n] = [.7, .3, 0, .7, 1, .3, .7, 1], followed by all 1's.
y[n] = [.7, 1, 1, .3, .7, 1, .3, 0], followed by all 0's.
w[n] = (1/h[0])(y[n] - h[1]w[n-1]) = y[n]/.7 - (.3/.7)w[n-1]
so
w[n] = [1, 1, 1, 0, 1, 1, 0, 0], followed by all 0's
Problem .
Suppose four different wires {I,II,III,IIII} have four different unit sample responses:
h1 = .25, .25, .25, .25, 0, ...
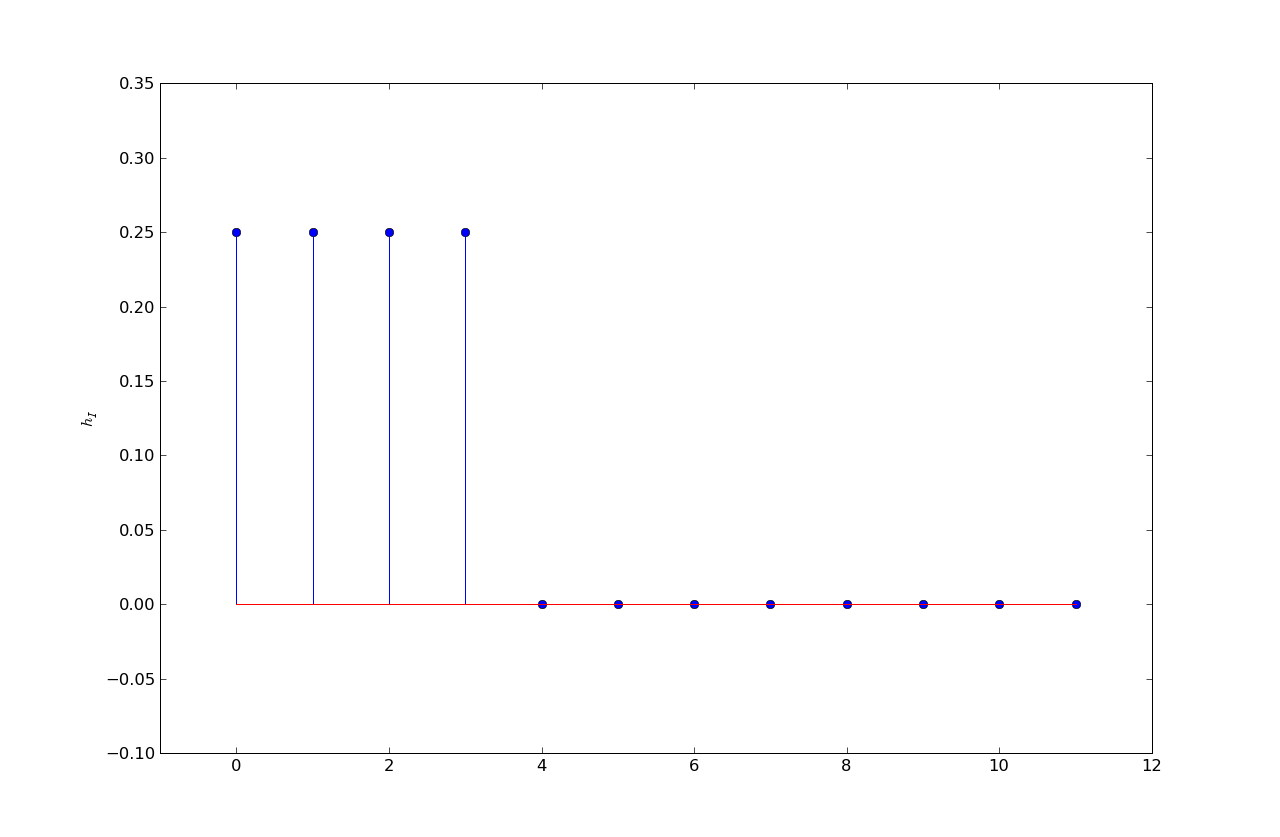
h2 = 0, .25, .5, .25, 0, ...
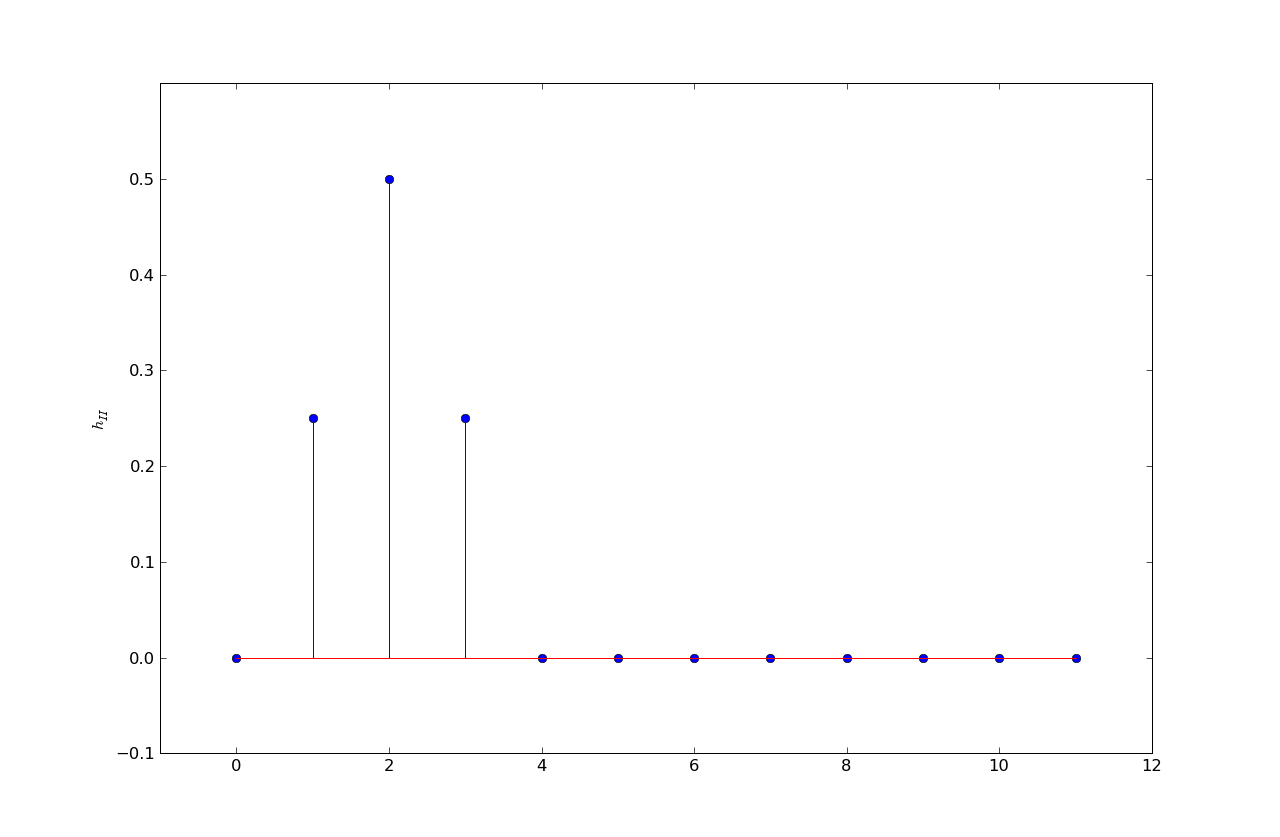
h3 = .11, .22, .33, .22, .11, 0, ...
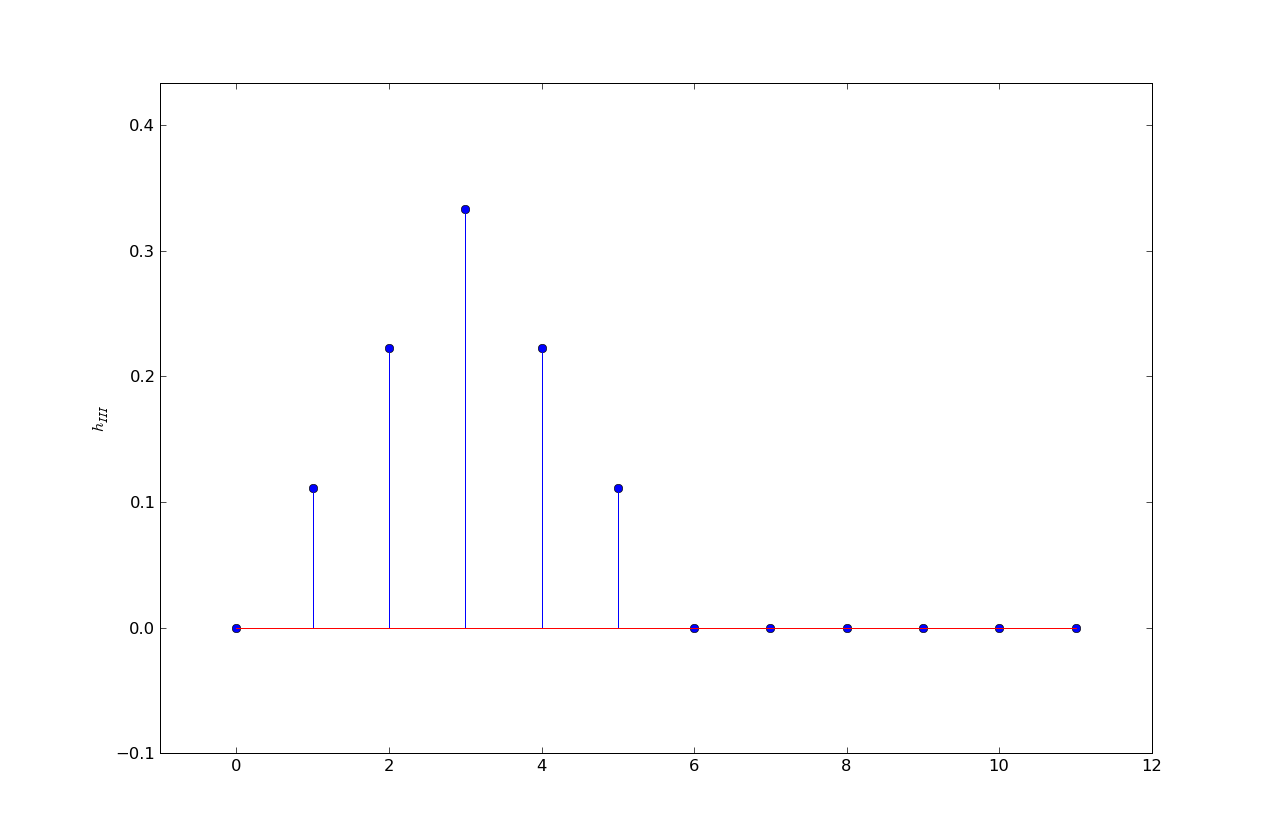
h4 = .04, .08, .12, .16, .20, .12, .12, .12, .04, 0, ...

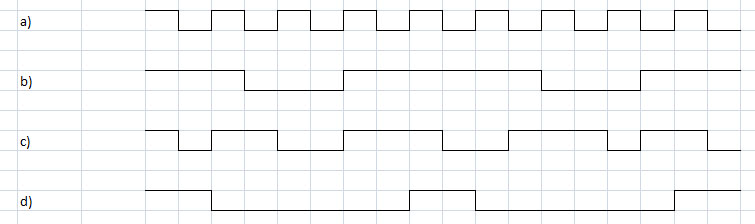
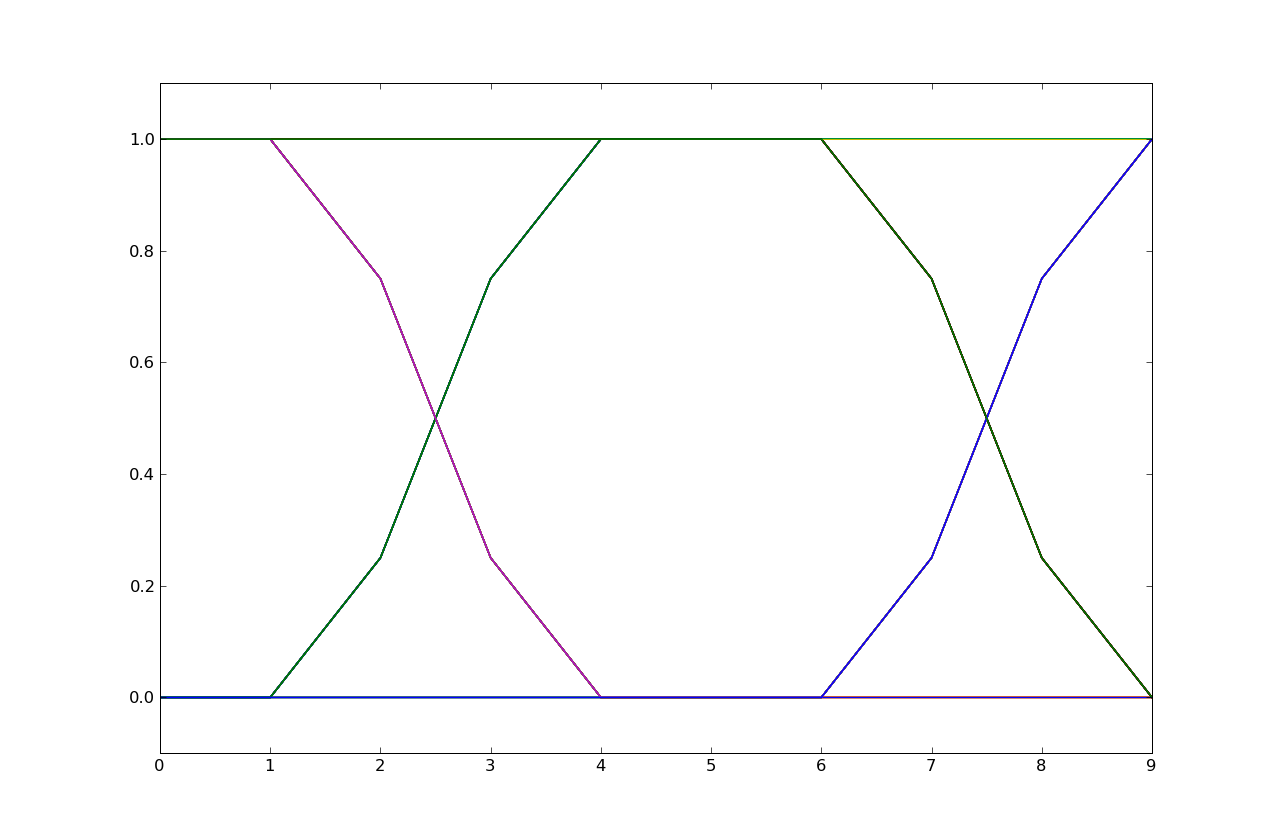
Each of the following eye diagrams is associated with transmitting bits using one of the four wires, where five samples were used per bit. That is, a one bit is five one-volt samples and a zero bit is five zero-volt samples. Please determine which wire was used in each case.
 The eye diagram is from h2. Note that the signal transitions take three samples
to complete and that the transitions occur in 3 steps with a larger slope
in the middle step, an indicator of a response with 3 taps with a larger middle
tap.
The eye diagram is from h2. Note that the signal transitions take three samples
to complete and that the transitions occur in 3 steps with a larger slope
in the middle step, an indicator of a response with 3 taps with a larger middle
tap.
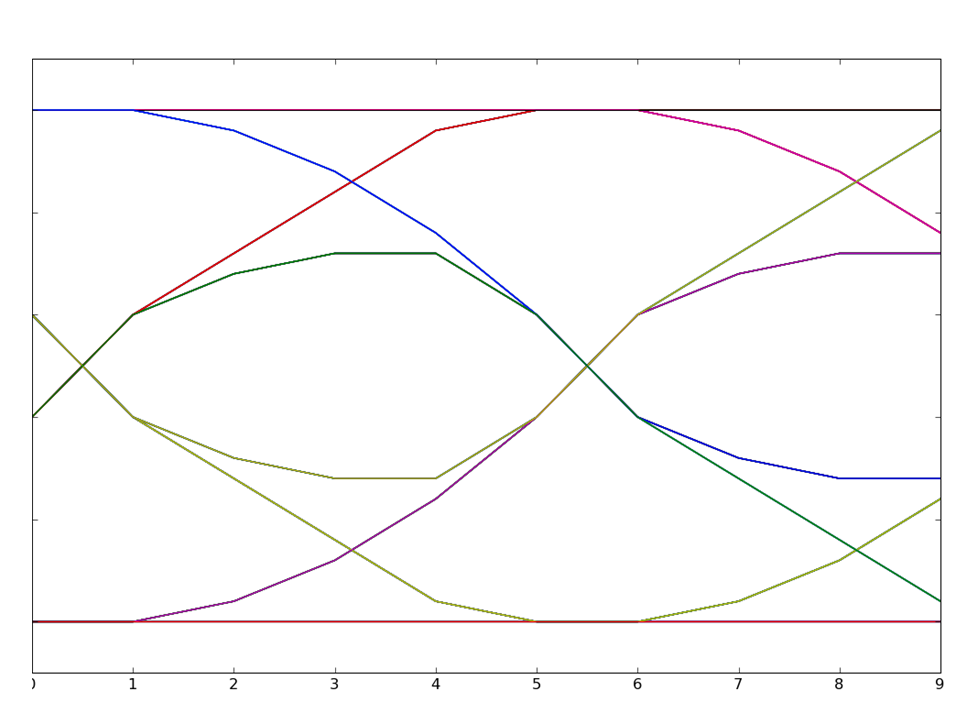 The eye diagram is from h4. Note that the signal transitions take more than five samples
to complete and hence result in considerable inter-symbol interference. Response h4
is the only response that's non-zero for more than 5 taps.
The eye diagram is from h4. Note that the signal transitions take more than five samples
to complete and hence result in considerable inter-symbol interference. Response h4
is the only response that's non-zero for more than 5 taps.
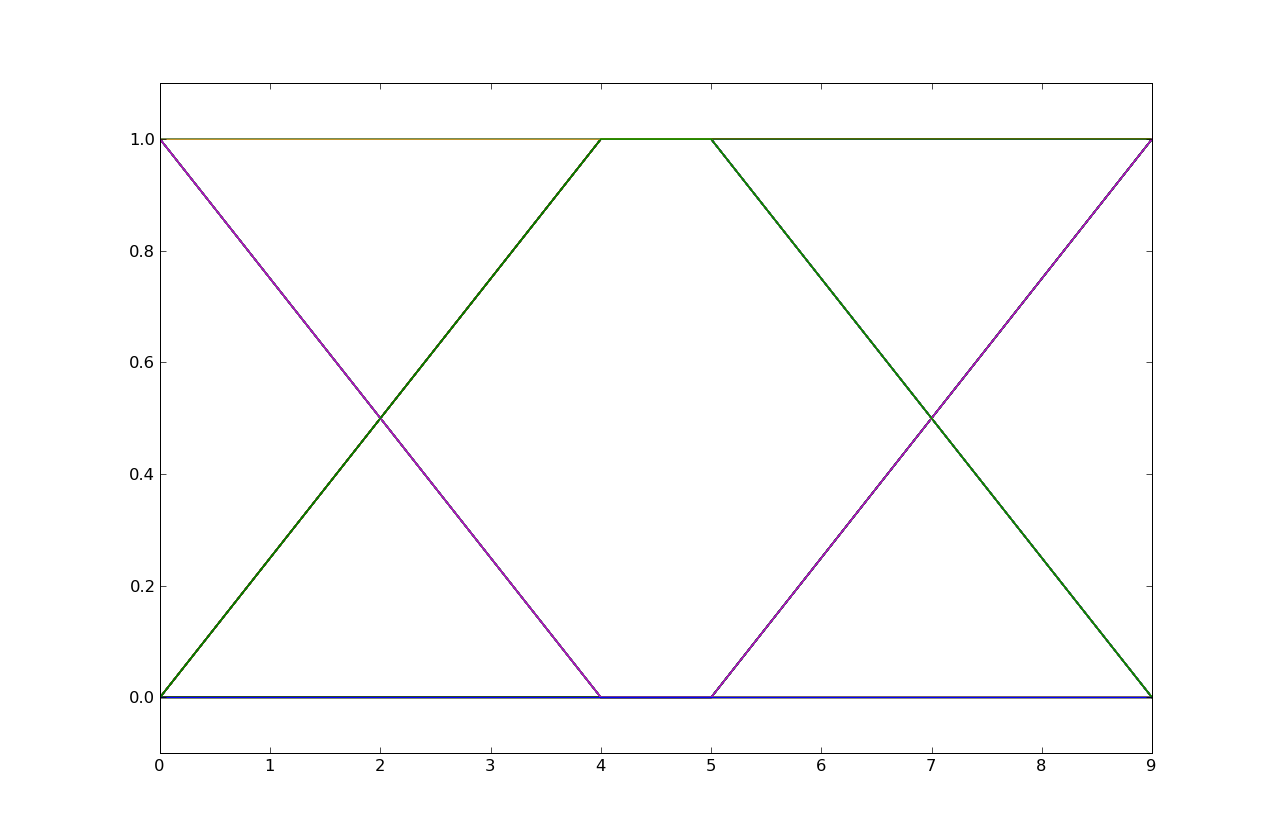 The eye diagram is from h1. Note that the signal transitions take four samples
to complete and that the transitions have constant slope, an indicator of
a response with 4 equal taps.
The eye diagram is from h1. Note that the signal transitions take four samples
to complete and that the transitions have constant slope, an indicator of
a response with 4 equal taps.
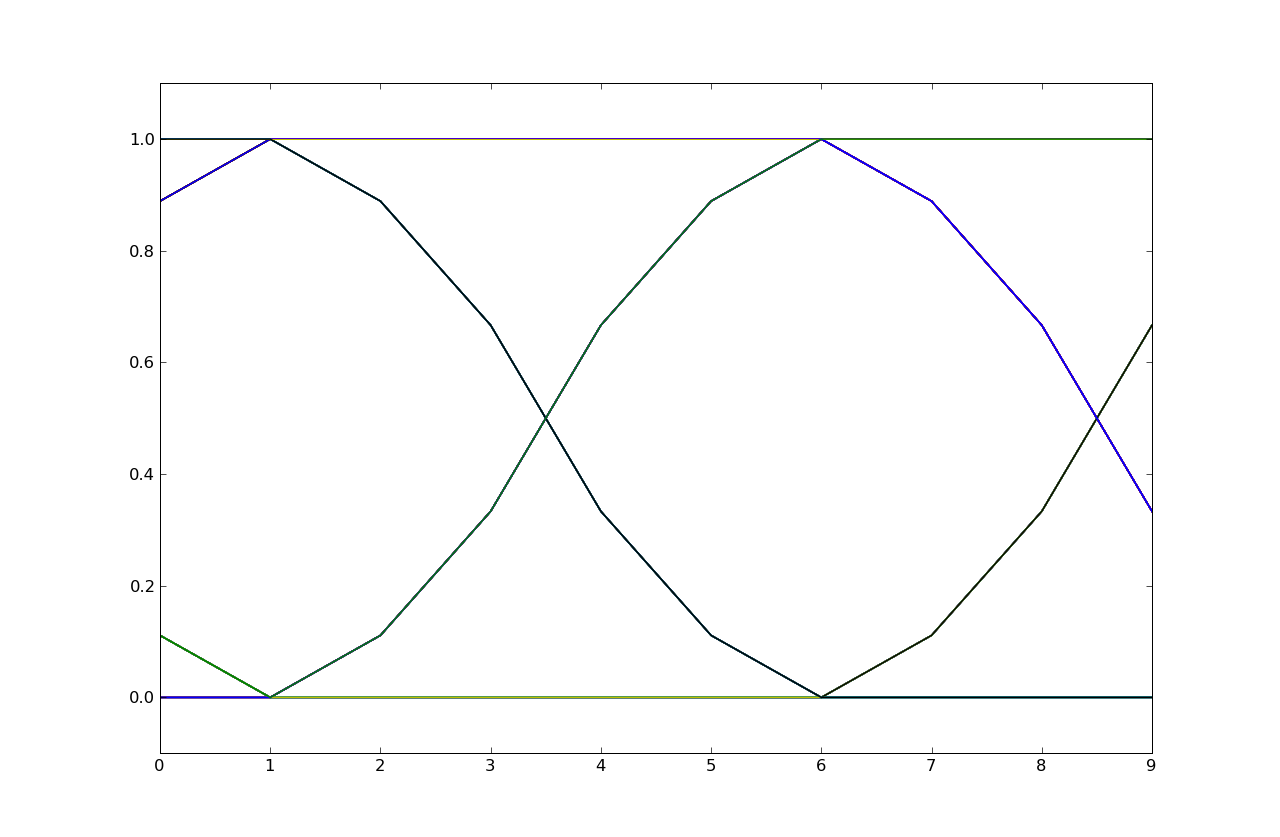 The eye diagram is from h3. Note that the signal transitions take five samples
to complete and that the transitions occur in 5 steps with larger slopes
in the middle of the transition, an indicator of a response with 5 taps with larger middle
taps.
The eye diagram is from h3. Note that the signal transitions take five samples
to complete and that the transitions occur in 5 steps with larger slopes
in the middle of the transition, an indicator of a response with 5 taps with larger middle
taps.
Problem .
Consider the following eye diagram from a transmission where five samples were used per bit. That is, a one bit was transmitted as five one-volt samples and a zero bit was transmitted five zero-volt samples. The eye diagram shows the voltages at the receiver.
The channel is charcterized by the following unit-sample response.
Determine the eight unique voltage values for sample number 8 in the eye diagram.
At sample number 8 we can see that there are 4 samples above and 4
samples below the nominal threshold at the half-way voltage value. This
means the inter-symbol interference is carrying over from the two previous
transmitted bits (which can take on 4 possible values: 00, 01, 10, and 11).
The eye diagram is showing us what happens when transmiting a 0-bit or a 1-bit
in the current bit cell, given the 4 possible choices for the previous two
bits.
Looking at the eye diagram, we can see that the first sample in a bit
time occurs at receiver sample 1 and 6 (the diagram shows two bit times),
(note that h[0] = 0).
So sample 8 in the eye diagram corresponds to the third sample in the
transmision of a bit. Thinking in terms of the convolution equation
y[n] = Σh[k]x[n-k]
and recalling that we're using 5 samples/bit, we can determine that
bits start at n = 0, 5, 10, ... So we if want to evaluate what
happens in the third sample of a bit time in a channel that has two bits
of ISI, y[12] is the first such value, i.e., the third sample
of the third bit time.
To determine y[12], it's useful convolve h4 with a unit step we get the unit-step response:
Now if we consider all possible values of the current bit and the previous
two bits (listed earliest-to-latest in the table below) we can use superposition
of hstep to compute the possible values at y[12].
So the eight unique values for y[12] are 0, .12, .16, .28, .72, .84, .88 and 1.
n           0    1     2     3     4     5     6     7     8     9
hstep[n] = 0.0, 0.04, 0.12, 0.24, 0.40, 0.60, 0.72, 0.84, 0.96, 1.00, ...
bits decomposed into unit steps computation for y[12] 1 1 1 u[n] y[12] = hstep[12] = 1 1 1 0 u[n] - u[n-10] y[12] = hstep[12] - hstep[2] = 1 - .12 = .88 1 0 1 u[n] - u[n-5] + u[n-10] y[12] = 1 - .84 + .12 = .28 1 0 0 u[n] - u[n-5] y[12] = 1 - .84 = .16
0 1 1 u[n-5] y[12] = .84 0 1 0 u[n-5] - u[n-10] y[12] = .84 - .12 = .72 0 0 1 u[n-10] y[12] = .12 0 0 0 y[12] = 0
Problem .
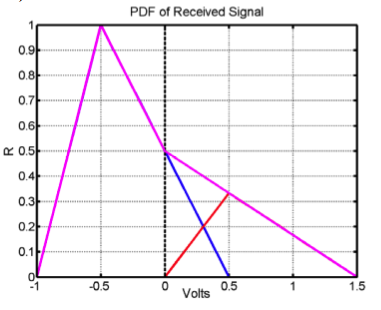
Messages are transmitted along a noisy channel using the following protocol: a "0" bit is transmitted as -0.5 Volt and a "1" bit as 0.5 Volt. The PDF of the total noise added by the channel, H, is shown below.
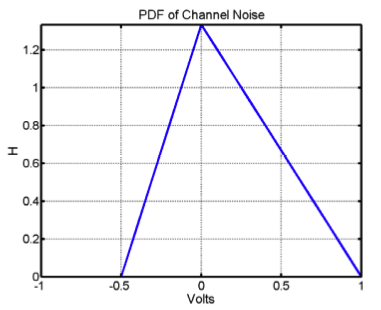
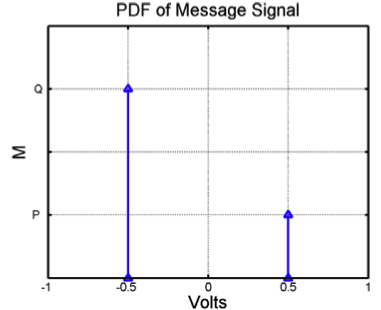 We know that Q=3P and that P+Q=1, so Q=0.75 and P=.25.
Problem .
This question refers to the LTI systems, I, II and III, whose unit-sample responses are shown below:
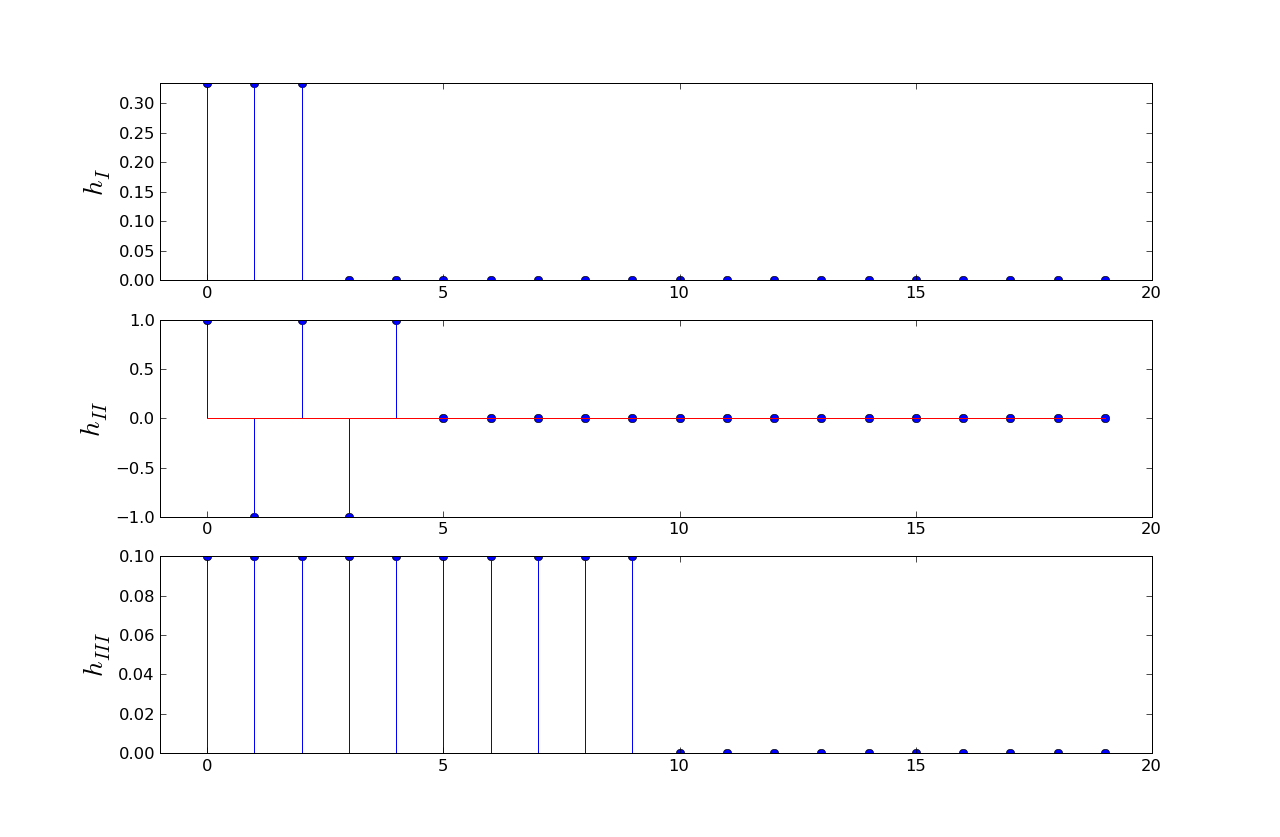
In this question, the input to these systems are bit streams with eight voltage samples per bit, with eight one-volt samples representing a one bit and eight zero-volt samples representing a zero bit.
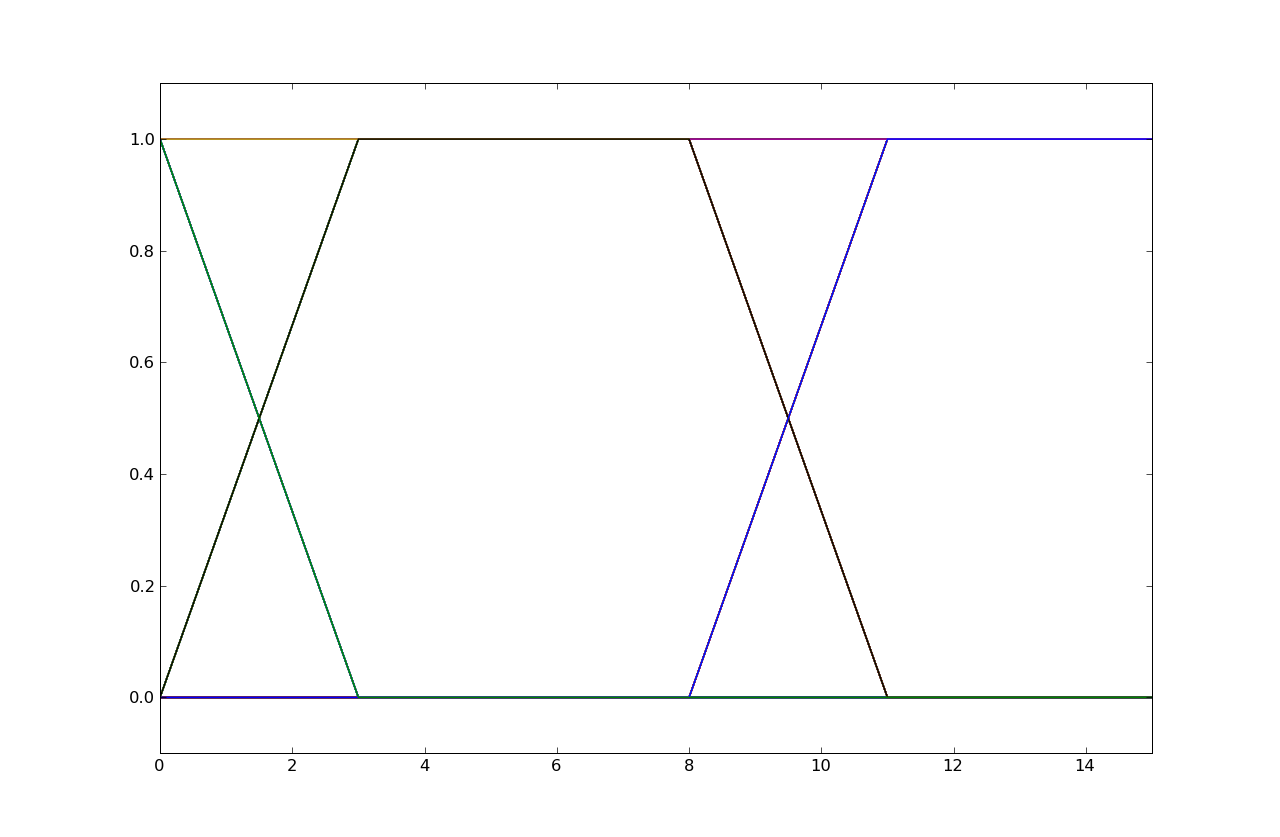 The rise or fall time of a transition as seen in the eye diagram is only 3 samples,
so it can only be System I since it's the only system with a 3-sample unit-sample
response. Note that all the systems have some ISI, but System I's ISI is limited
to only 3 samples after which the received signal is stable for the remainder
of the bit cell.
The rise or fall time of a transition as seen in the eye diagram is only 3 samples,
so it can only be System I since it's the only system with a 3-sample unit-sample
response. Note that all the systems have some ISI, but System I's ISI is limited
to only 3 samples after which the received signal is stable for the remainder
of the bit cell.
This question refers to a fourth LTI system whose unit-sample response, hIV[n], is given below:
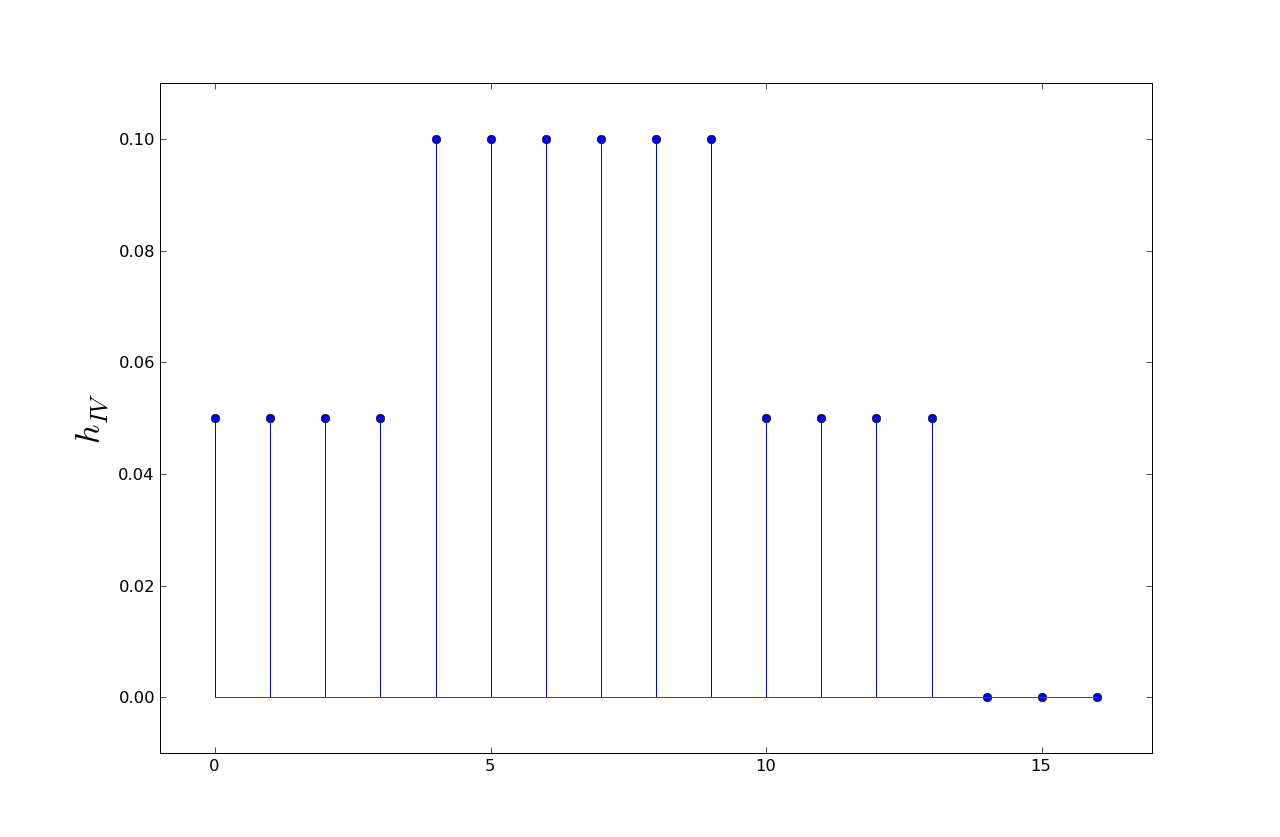
where, just like in (A), the input to this system is a bit stream with eight voltage samples per bit, with eight one-volt samples representing a one bit and eight zero-volt samples representing a zero bit.
where we've left out the terms in the convolution sum where x[n] is 0.
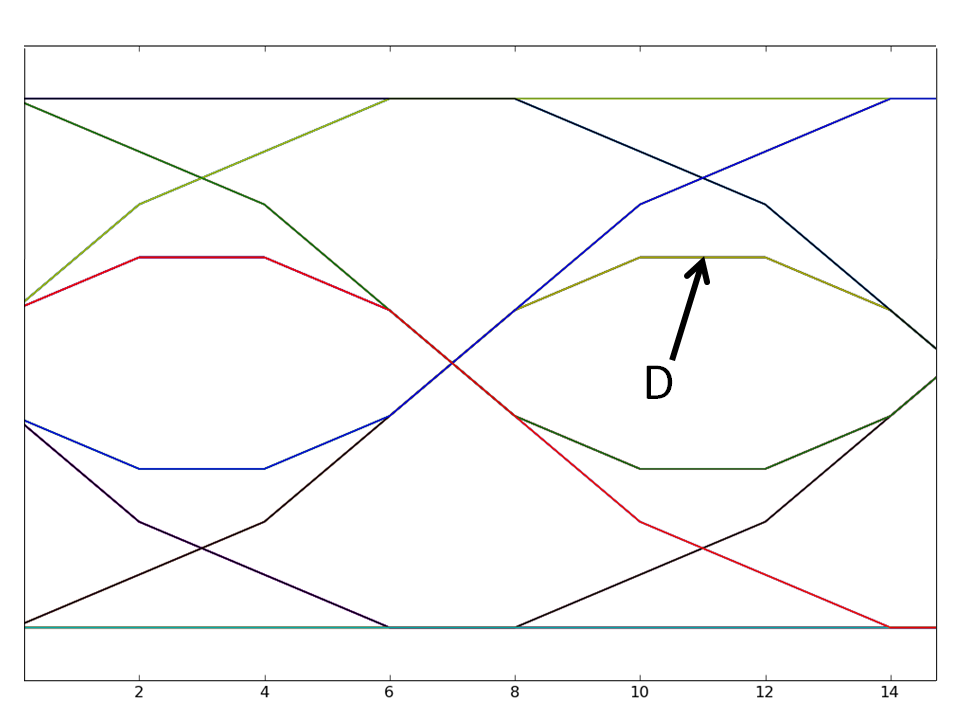 The lowest curve above threshold, i.e., the curve the arrow points at,
must be due to the transmission of an isolated 1-bit, preceded and followed
by 0-bits. This corresponds to a sample stream of 8 zeros, followed by
8 ones, followed by another 8 zeros. We can generate the entire received
waveform by convolving this sample stream with the given unit-sample
response. But since D is at the maximum value, we can compute its value
from the convolution sum when the 8 one samples overlap the 6 values of
0.1 in the response. So
The lowest curve above threshold, i.e., the curve the arrow points at,
must be due to the transmission of an isolated 1-bit, preceded and followed
by 0-bits. This corresponds to a sample stream of 8 zeros, followed by
8 ones, followed by another 8 zeros. We can generate the entire received
waveform by convolving this sample stream with the given unit-sample
response. But since D is at the maximum value, we can compute its value
from the convolution sum when the 8 one samples overlap the 6 values of
0.1 in the response. So
D = (1)(0.05) + (1)(0.1) + (1)(0.1) + (1)(0.1) + (1)(0.1) + (1)(0.1) + (1)(0.1) + (1)(0.05)
  = 0.7
Problem .
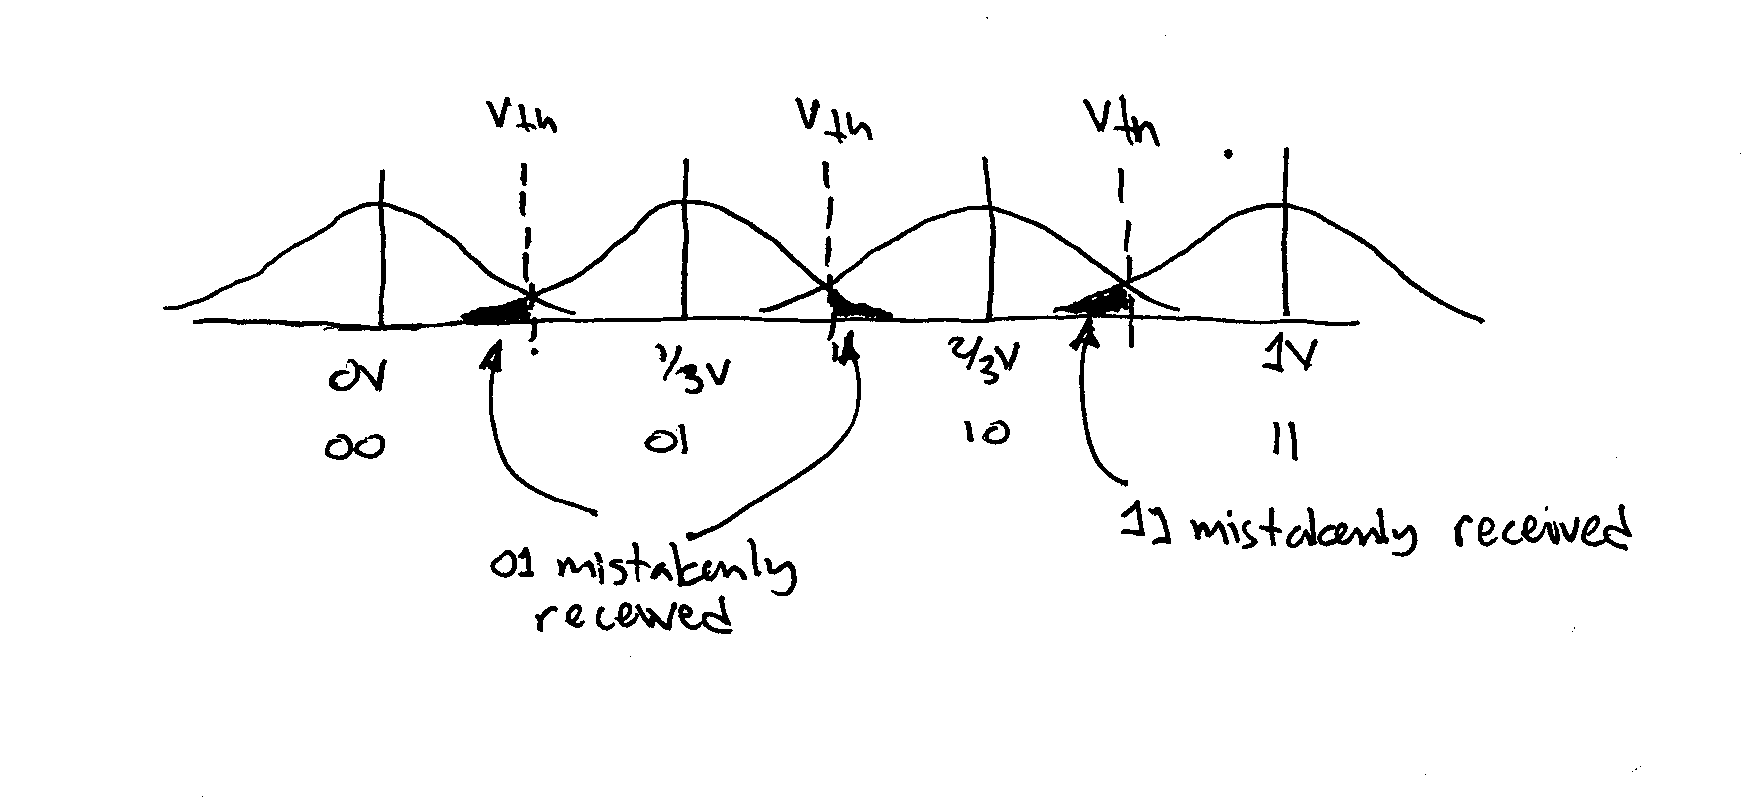
Consider a transmitter that encodes pairs of bits using four voltage values. Specifically:
For this problem we will assume a wire that only adds noise. That is,
y[n] = x[n] + noise[n]
where y[n] is the received sample, x[n] the transmitted sample whose value is one of the above four voltages, and noise[n] is a random variable.
Please assume all bit patterns are equally likely to be transmitted.
Suppose the probability density function for noise[n] is a constant, K, from -0.05 volts to 0.05 volts and zero elsewhere.
     +---------------------+  height K
     |                     |
     |                     |
-----+----------|----------+-------
    -.05        0         +.05
We know the area under the PDF curve must be 1 and since the area
is given by (.1)(K) then K = 10.
Suppose now Vhigh= 1.0 volts and the probability density function for noise[n] is a zero-mean Normal with standard deviation σ.
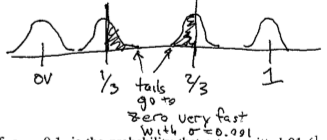
Each of the humps is a Gaussian distribution, so the two shaded areas each is exactly one half of a hump and so has area 1/2. Now we just need to scale those area by the probabilities that Vxmit = 1/3V and Vxmit = 2/3V:
prob = (1/2)prob(Vxmit = 1/3) + (1/2)prob(Vxmit = 2/3) = (1/2)(1/4) + (1/2)(1/4) = 1/4