

The input sequence to a linear time-invariant (LTI) system is given by
and the output of the LTI system is given by
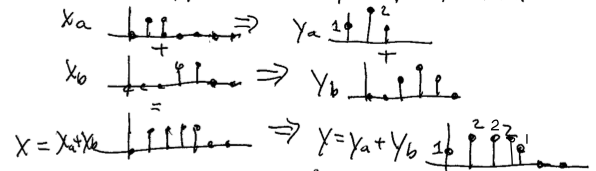
So y = 1, 2, 2, 2, 1, 0, 0, ... when n ≥ 0, 0 otherwise.
Determine the output y[n] for a system with the input x[n] and unit-sample response h[n] shown below. Assume h[n]=0 and x[n]=0 for any times n not shown.
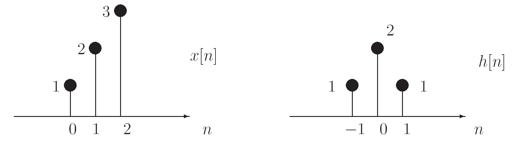
y[n] = Σx[k]h[n-k] = x[0]h[n] + x[1]h[n-1] + x[2]h[n-2]
     = δ[n+1] + 4δ[n] + 8δ[n-1] + 8δ[n-2] + 3δ[n-3]

δ[n] = u[n] - u[n-1]
Since the system is linear we can compute the response of the system to the input δ[n] using the superposition of the appropriately scaled and shifted v[n]:
h[n] = v[n] - v[n-1]
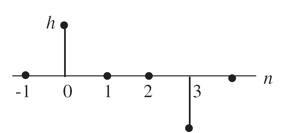
The result is shown in the figure below:
Problem .
The output of a particular communication channel is given by
y[n] = αx[n] + βx[n-1] where α > β
It's easy to verify both properities given the channel response above, so the channel is linear.
To be time invariant the channel must have the property that if we shift the input by some number of samples s, the output also shifts by s samples. Again that property is easily verified given the channel response above, so the channel is time invariant.
Using the channel response given above, the channel's unit-sample reponse can be computed as
h[0]=α,
h[1]=β,
h[n]=0 for all other values of n
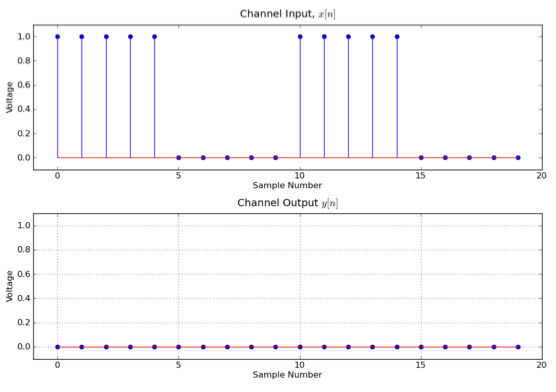
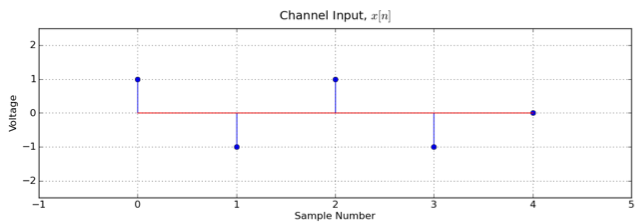
x[n] = [1, 0, 0, 1, 1, 0, 1, 1], followed by all 1's.
then what is the channel's output assuming α=.7 and β=.3?
y[n] = [.7, .3, 0, .7, 1, .3, .7, 1], followed by all 1's.
y[n] = [.7, 1, 1, .3, .7, 1, .3, 0], followed by all 0's.
w[n] = (1/h[0])(y[n] - h[1]w[n-1]) = y[n]/.7 - (.3/.7)w[n-1]
so
w[n] = [1, 1, 1, 0, 1, 1, 0, 0], followed by all 0's
Problem .
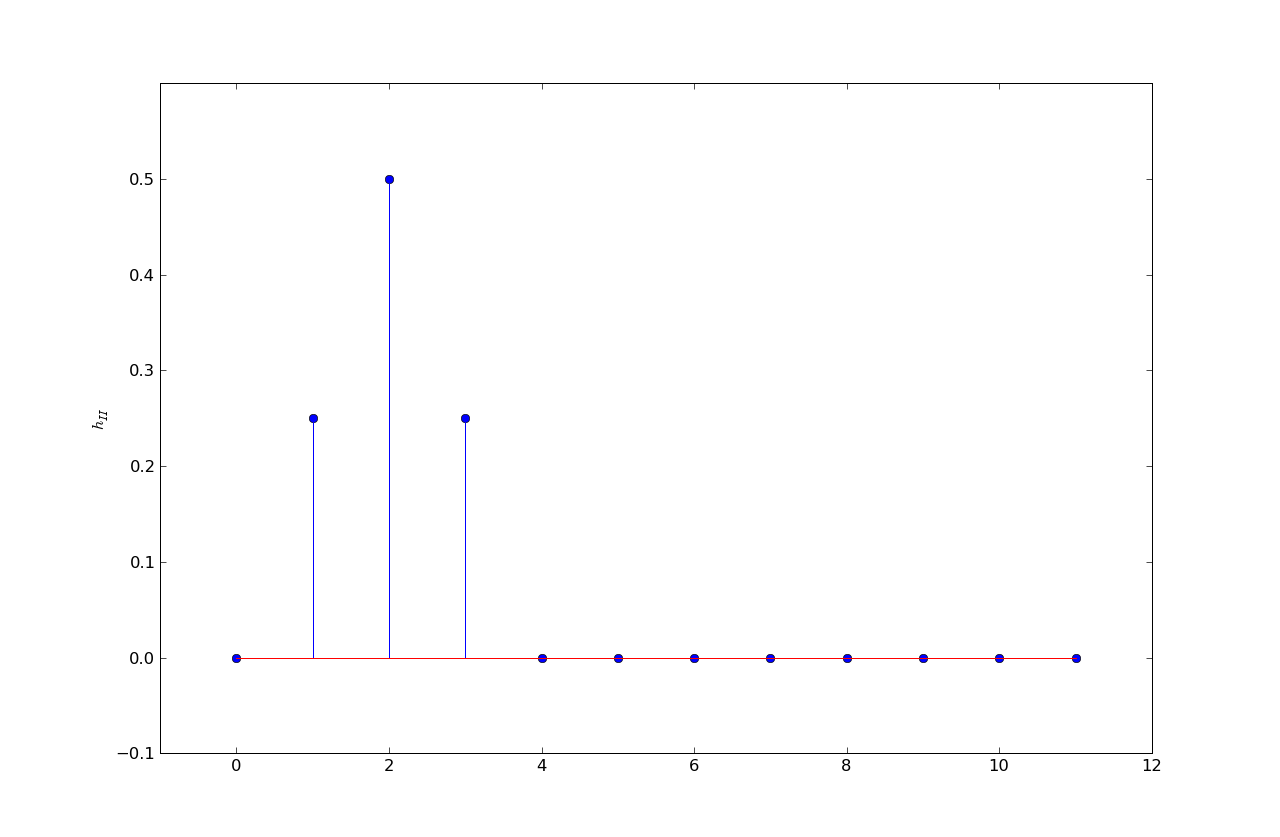
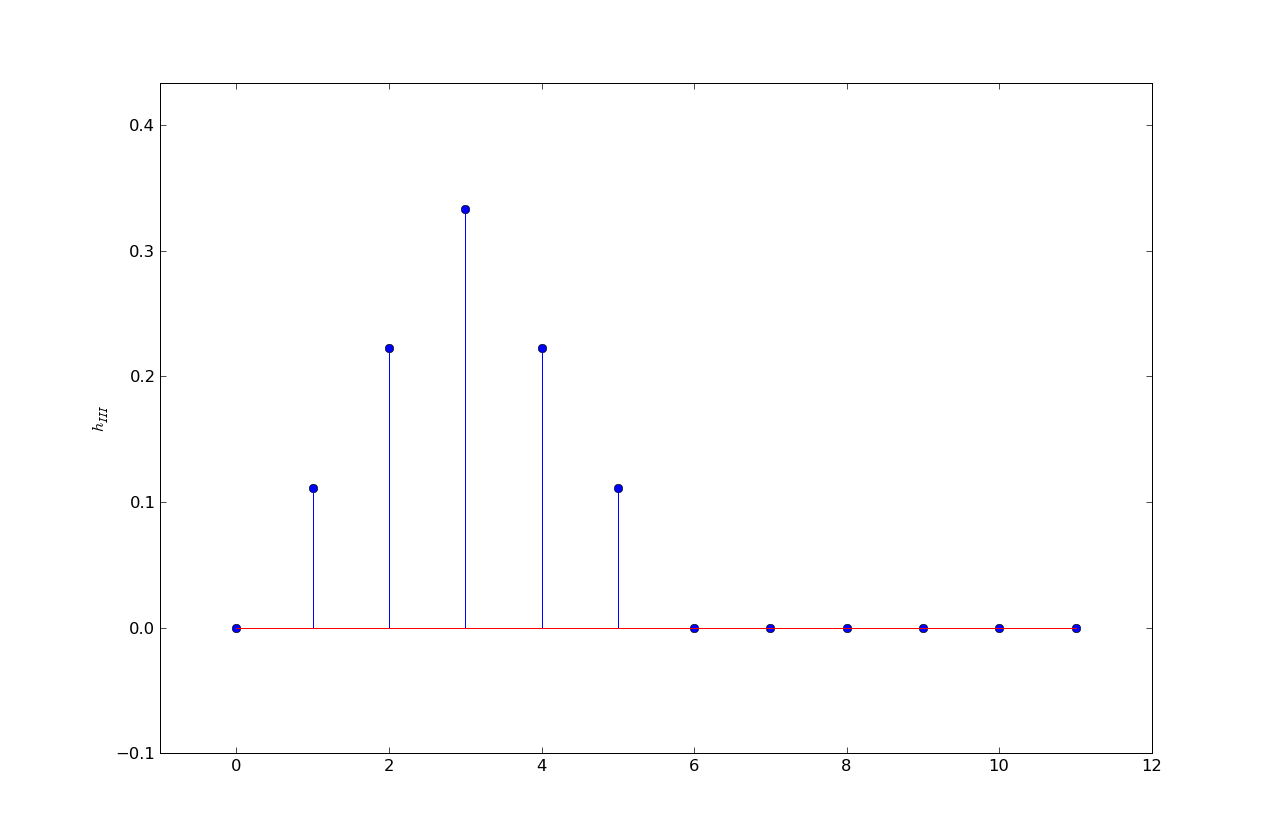
Suppose four different wires {I,II,III,IIII} have four different unit sample responses:
h1 = .25, .25, .25, .25, 0, ...
h2 = 0, .25, .5, .25, 0, ...
h3 = .11, .22, .33, .22, .11, 0, ...
h4 = .04, .08, .12, .16, .20, .12, .12, .12, .04, 0, ...
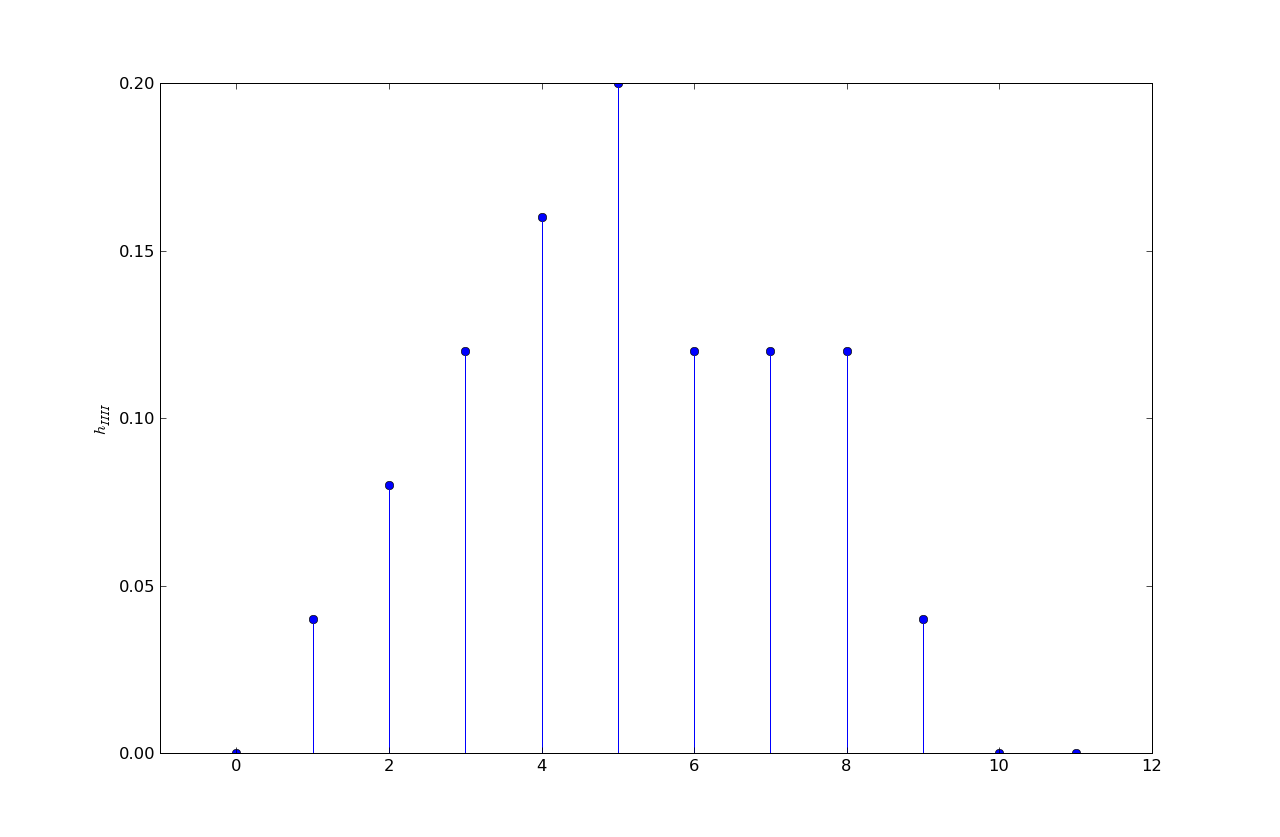
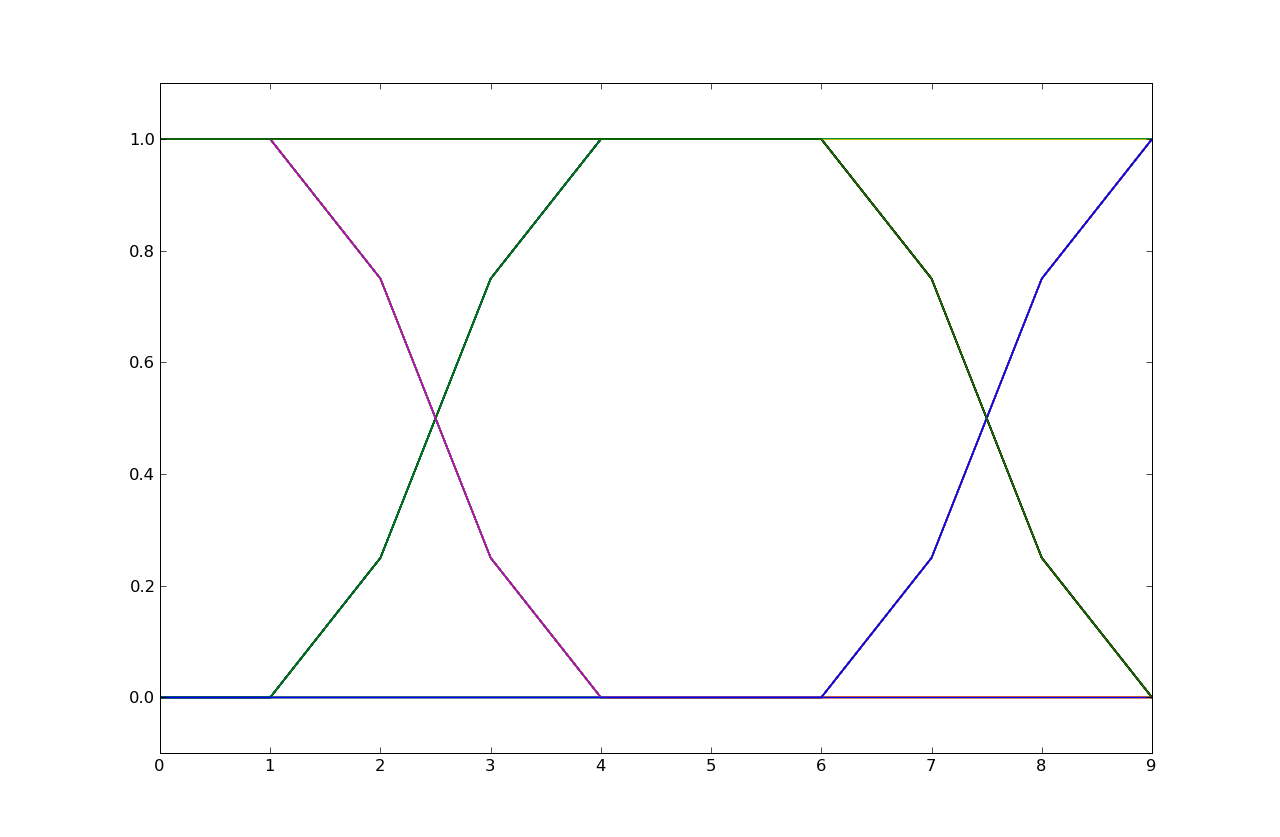
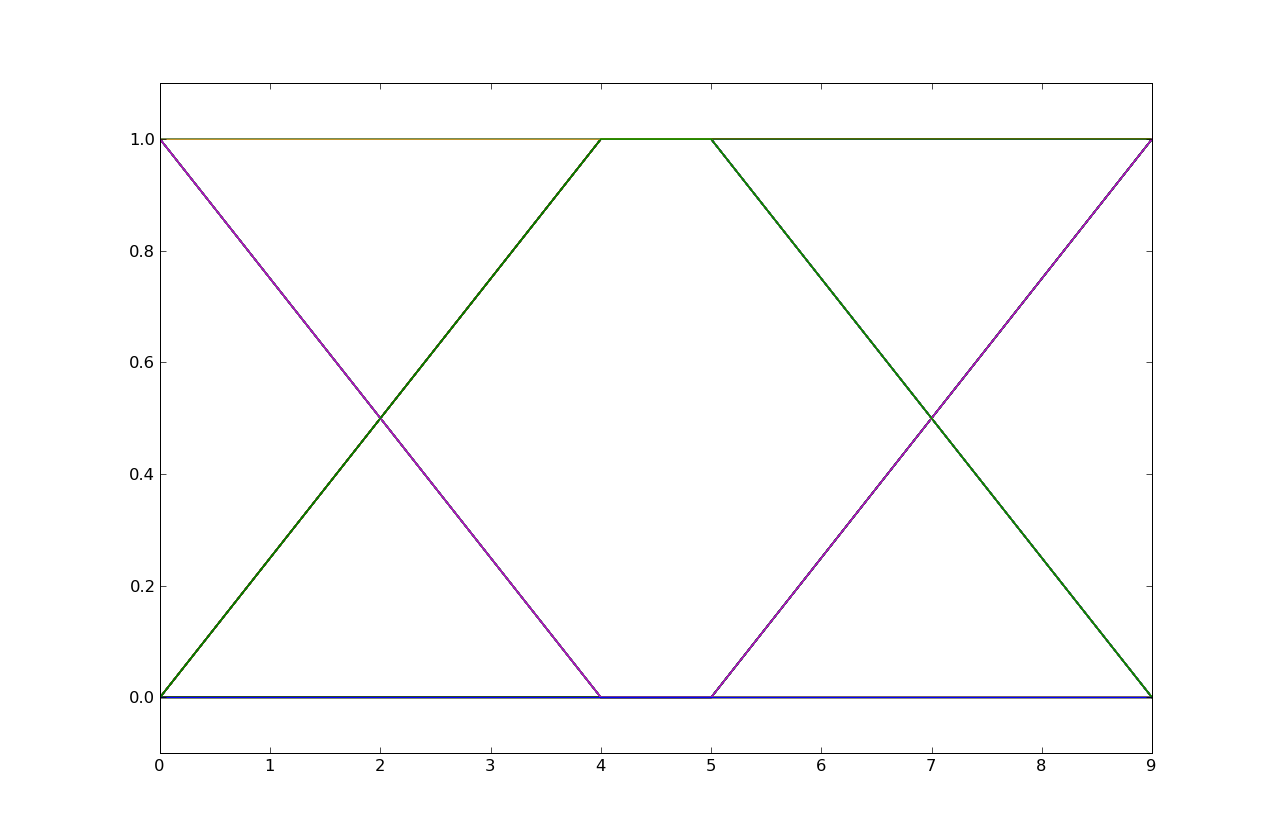
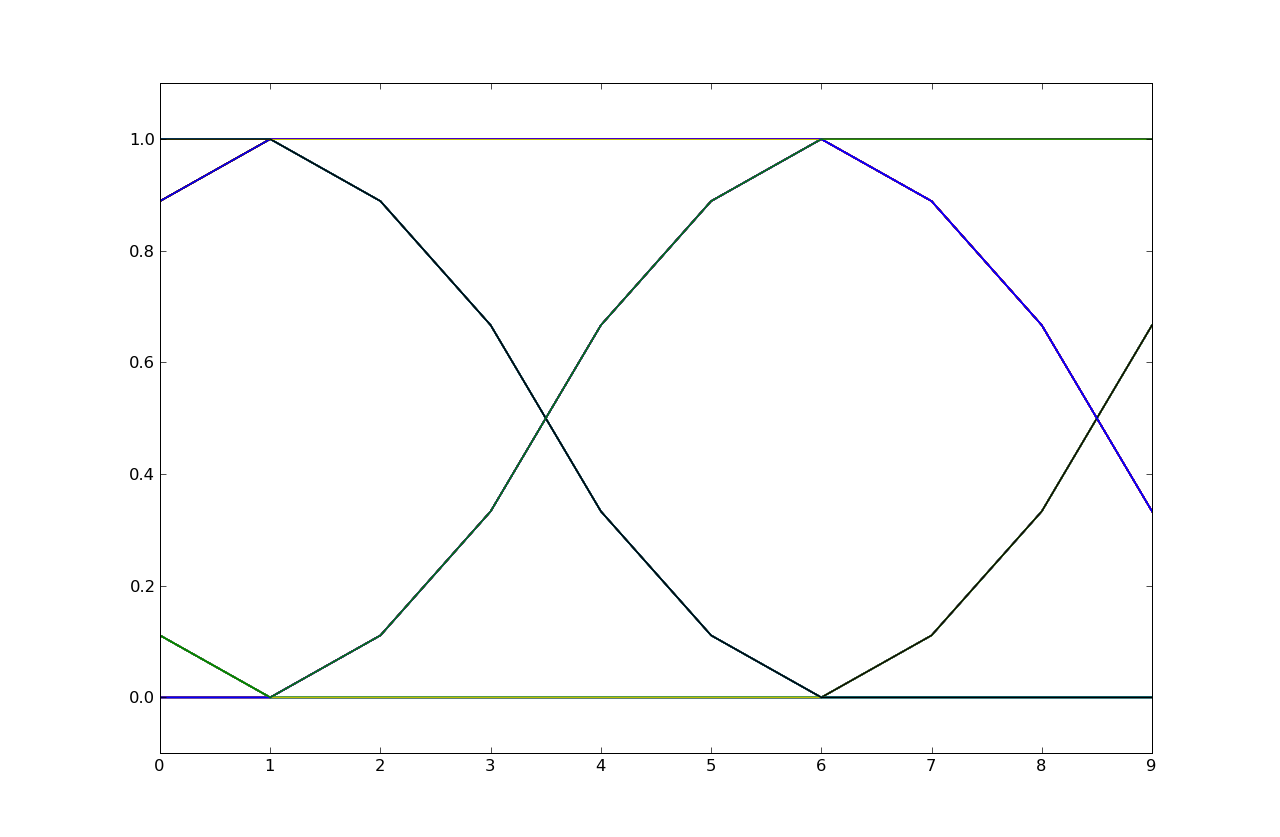
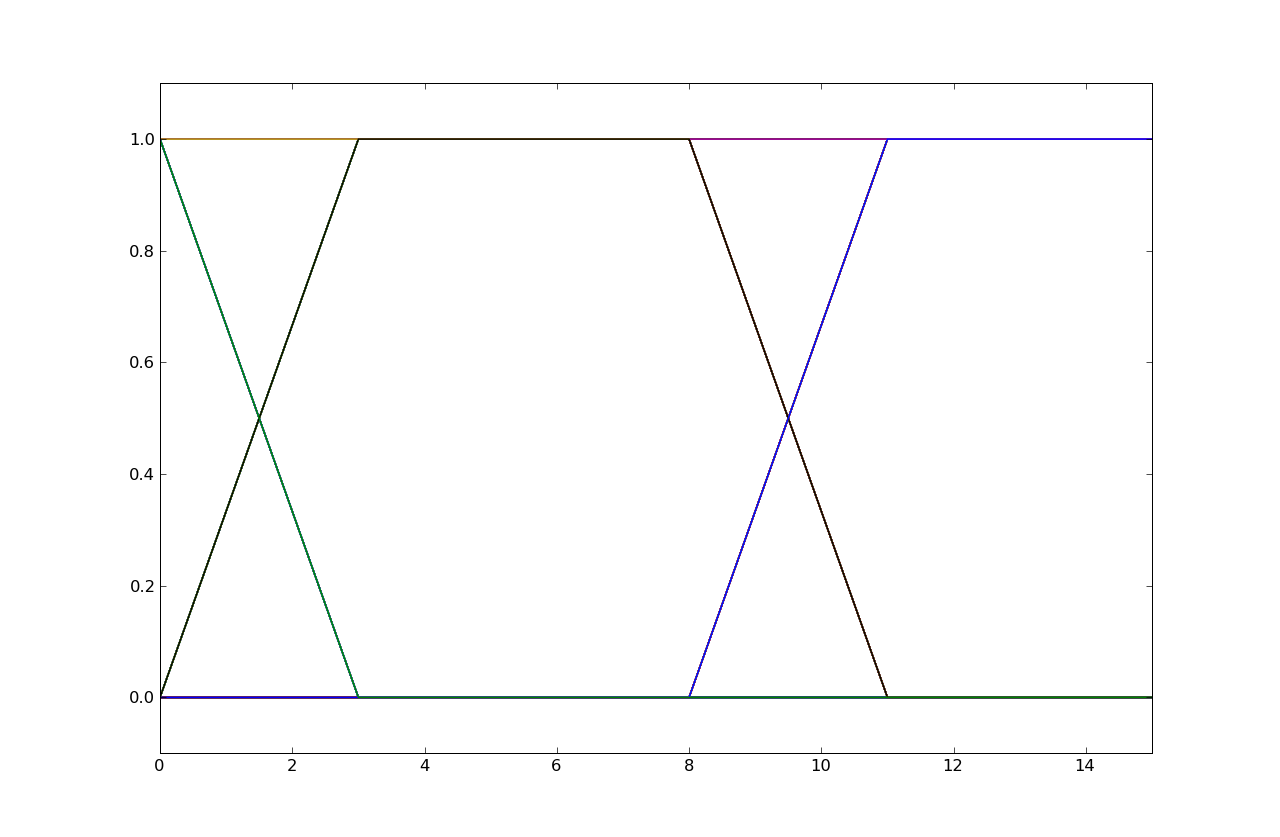
Each of the following eye diagrams is associated with transmitting bits using one of the four wires, where five samples were used per bit. That is, a one bit is five one-volt samples and a zero bit is five zero-volt samples. Please determine which wire was used in each case.
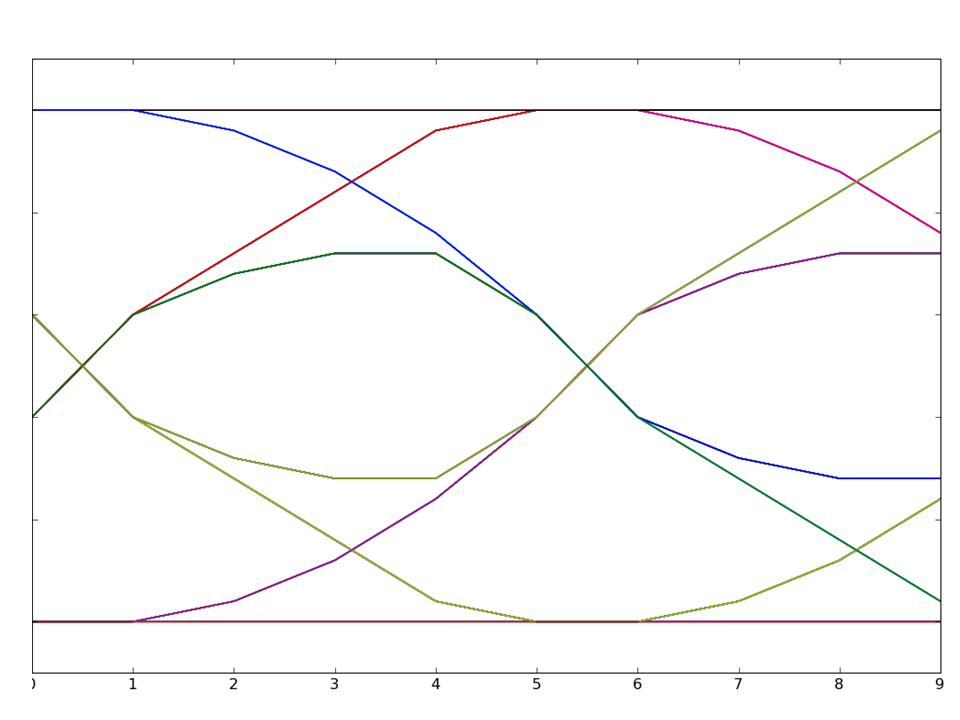
Problem .
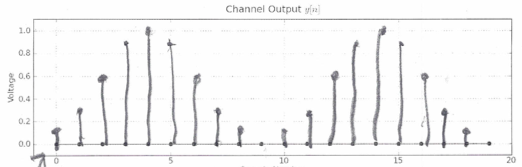
Consider the following eye diagram from a transmission where five samples were used per bit. That is, a one bit was transmitted as five one-volt samples and a zero bit was transmitted five zero-volt samples. The eye diagram shows the voltages at the receiver.
The channel is charcterized by the following unit-sample response.
Determine the eight unique voltage values for sample number 8 in the eye diagram.
At sample number 8 we can see that there are 4 samples above and 4 samples below the nominal threshold at the half-way voltage value. This means the inter-symbol interference is carrying over from the two previous transmitted bits (which can take on 4 possible values: 00, 01, 10, and 11). The eye diagram is showing us what happens when transmiting a 0-bit or a 1-bit in the current bit cell, given the 4 possible choices for the previous two bits.
Looking at the eye diagram, we can see that the first sample in a bit time occurs at receiver sample 1 and 6 (the diagram shows two bit times), (note that h[0] = 0). So sample 8 in the eye diagram corresponds to the third sample in the transmision of a bit. Thinking in terms of the convolution equation
y[n] = Σh[k]x[n-k]
and recalling that we're using 5 samples/bit, we can determine that bits start at n = 0, 5, 10, ... So we if want to evaluate what happens in the third sample of a bit time in a channel that has two bits of ISI, y[12] is the first such value, i.e., the third sample of the third bit time.
To determine y[12], it's useful convolve h4 with a unit step we get the unit-step response:
n           0    1     2     3     4     5     6     7     8     9
hstep[n] = 0.0, 0.04, 0.12, 0.24, 0.40, 0.60, 0.72, 0.84, 0.96, 1.00, ...
Now if we consider all possible values of the current bit and the previous two bits (listed earliest-to-latest in the table below) we can use superposition of hstep to compute the possible values at y[12].
| bits | decomposed into unit steps | computation for y[12] |
|---|---|---|
| 1 1 1 | u[n] | y[12] = hstep[12] = 1 |
| 1 1 0 | u[n] - u[n-10] | y[12] = hstep[12] - hstep[2] = 1 - .12 = .88 |
| 1 0 1 | u[n] - u[n-5] + u[n-10] | y[12] = 1 - .84 + .12 = .28 |
| 1 0 0 | u[n] - u[n-5] | y[12] = 1 - .84 = .16 |
| 0 1 1 | u[n-5] | y[12] = .84 |
| 0 1 0 | u[n-5] - u[n-10] | y[12] = .84 - .12 = .72 |
| 0 0 1 | u[n-10] | y[12] = .12 |
| 0 0 0 | y[12] = 0 |
So the eight unique values for y[12] are 0, .12, .16, .28, .72, .84, .88 and 1.
Problem .
This question refers to the LTI systems, I, II and III, whose unit-sample responses are shown below:
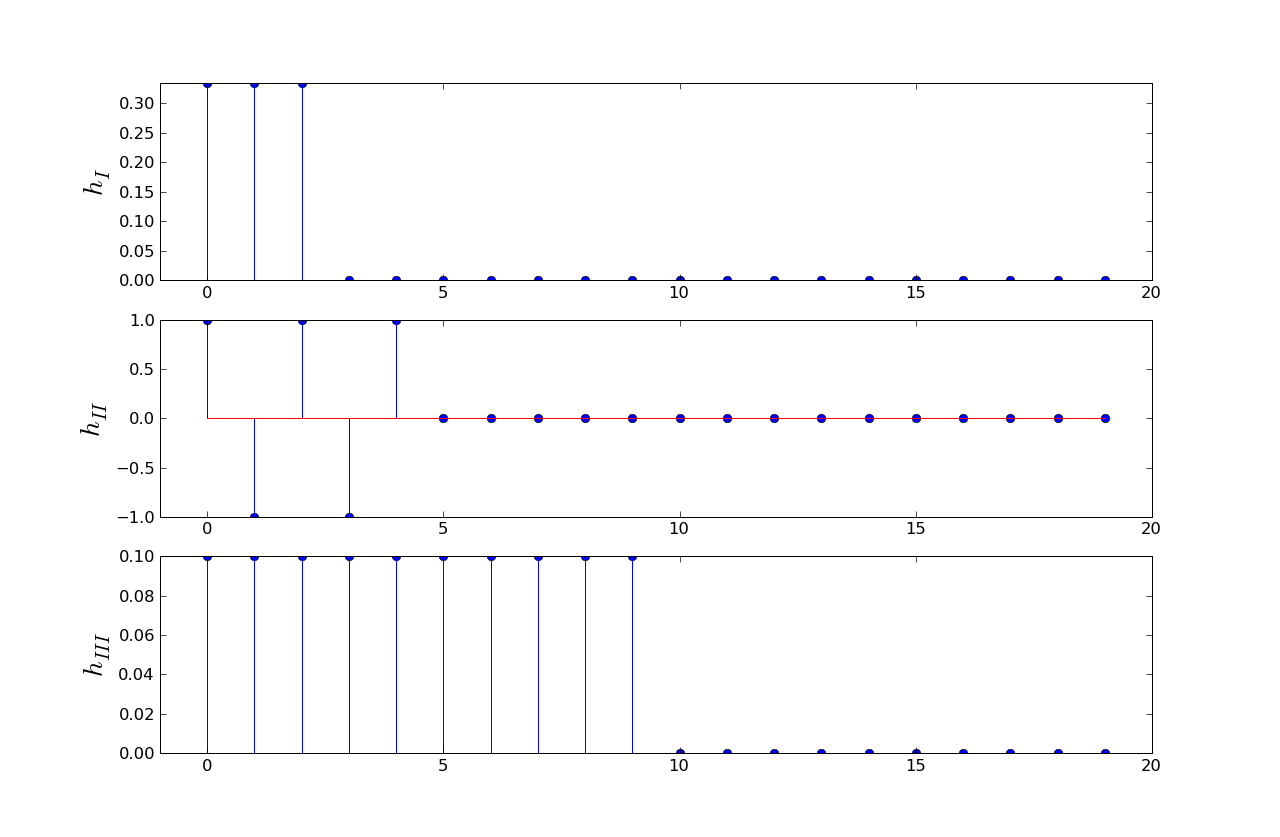
In this question, the input to these systems are bit streams with eight voltage samples per bit, with eight one-volt samples representing a one bit and eight zero-volt samples representing a zero bit.
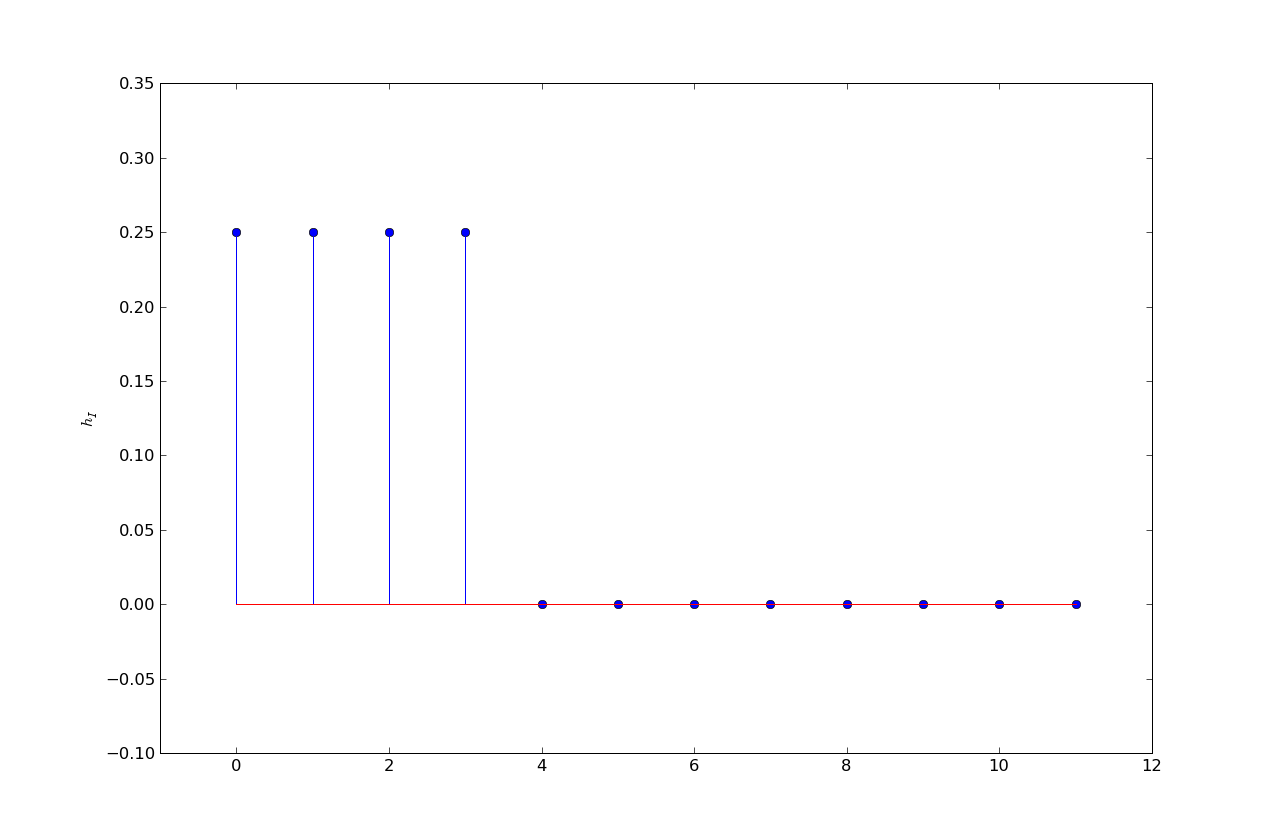
This question refers to a fourth LTI system whose unit-sample response, hIV[n], is given below:
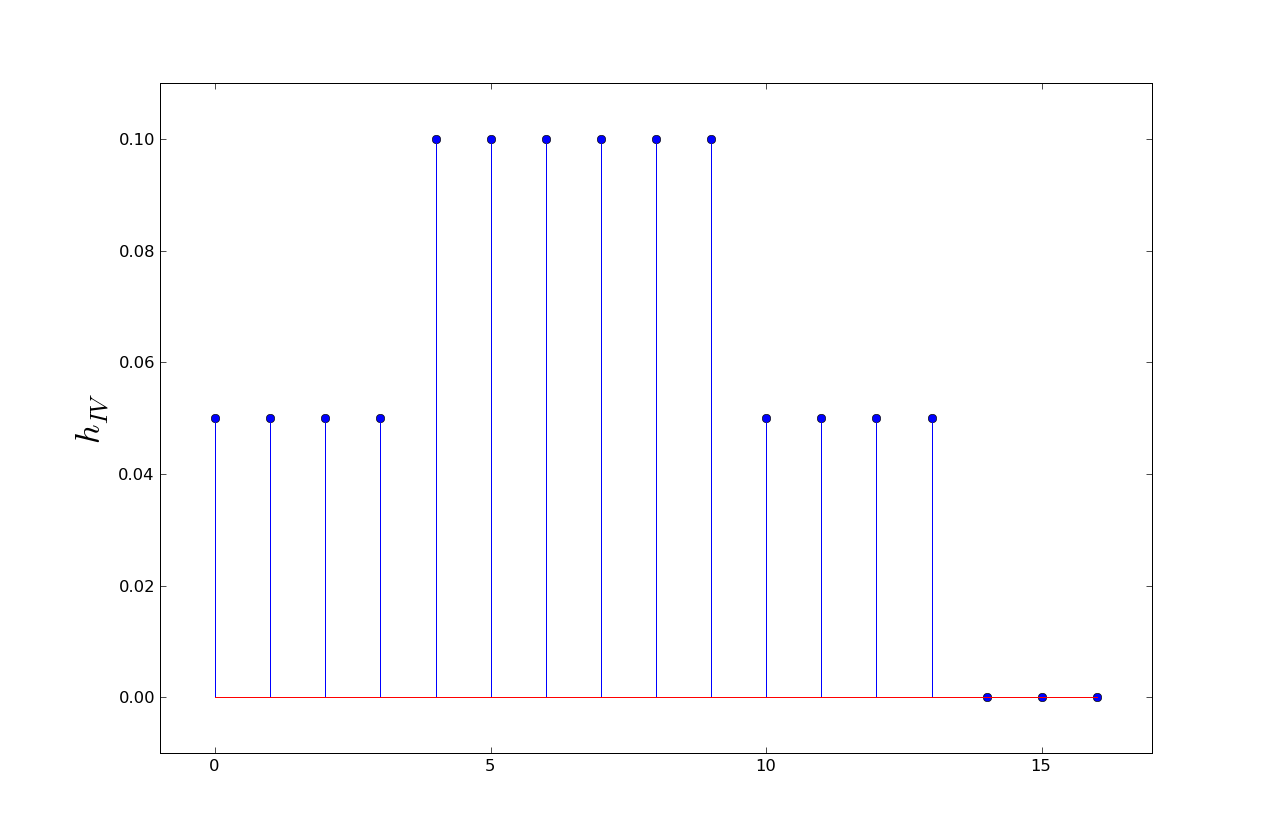
where, just like in (A), the input to this system is a bit stream with eight voltage samples per bit, with eight one-volt samples representing a one bit and eight zero-volt samples representing a zero bit.
D = (1)(0.05) + (1)(0.1) + (1)(0.1) + (1)(0.1) + (1)(0.1) + (1)(0.1) + (1)(0.1) + (1)(0.05)
  = 0.7
where we've left out the terms in the convolution sum where x[n] is 0.
Suppose a linear time-variant channel has a unit sample response given by
h[n] = 1/2  n = 0, 1, 2
h[n] = 0    otherwise
If the input to the channel is
x[n] = 3/2  n = 2, 3, 4
x[n] = 0    otherwise
please determine the maximum value of the output of the channel and the index at which that maximum occurs.
y[n] = x[n]h[0] + x[n-1]h[1] + x[n-2]h[2]and three non-zero x[n] values, all positive. So the maximum value of y[n] occurs when using all three x[n] values:
y[4] = x[4]h[0] + x[3]h[1] + x[2]h[2]
     = (3/2)(1/2) + (3/2)(1/2) + (3/2)(1/2)
     = 9/4
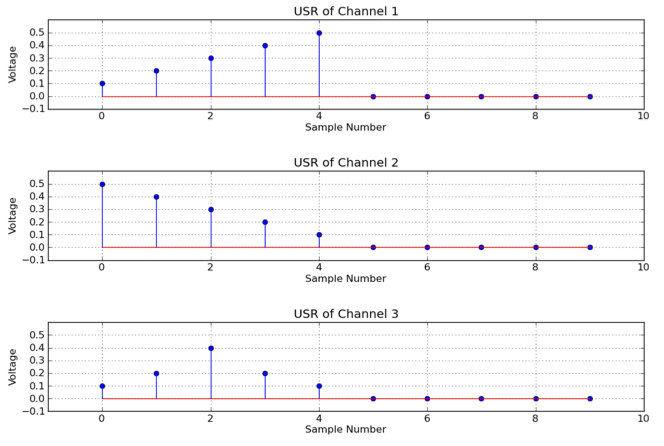
For this problem, please consider three linear and time-invariant channels, channel one, channel two, and channel three. The unit sample response for each of these three channels are plotted below. Please use these plots to answer all the parts of this question.
The maximum value happens after the transition is complete, so we just need to sum all the h[n] values:
Σh[n] = 0.5 + 0.4 + 0.3 + 0.2 + 0.1 = 1.5
Using the convolution sum and noticing that h[m] = 0, m ≥ 5:
y[24] = x[24]h[0] + x[23]h[1] + x[22]h[2] + x[21]h[3] + x[20]h[4]
      = (0)(0.1) + (1)(0.2) + (1)(0.4) + (1)(0.2) + (0)(0.2)
      = 0.2 + 0.4 + 0.2
      = 0.8
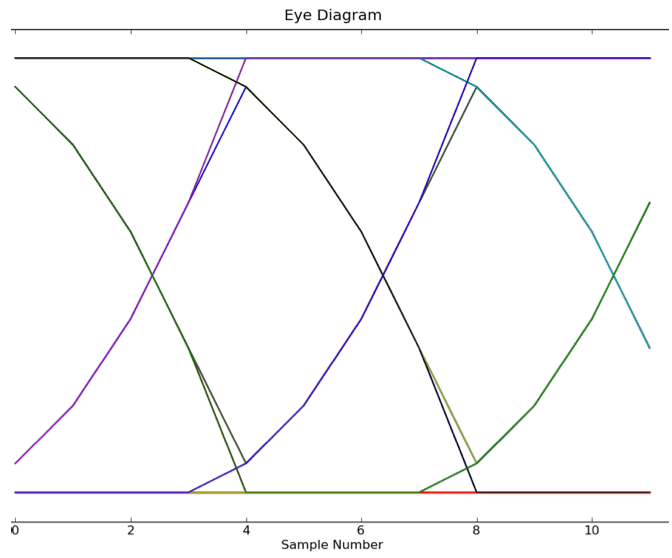
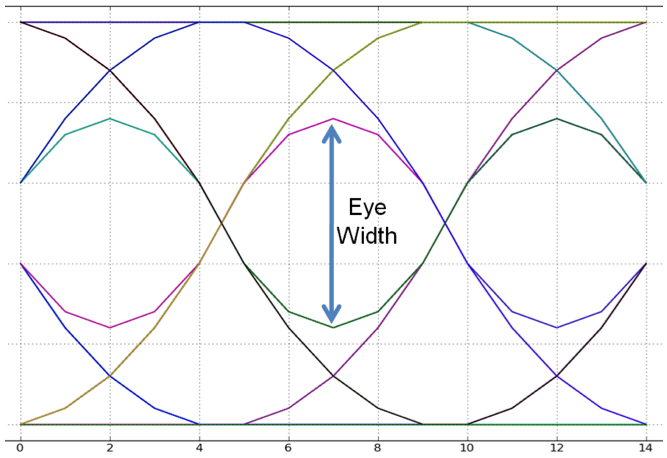
The eye is at its "widest" (measuring vertically) at samples 4 and 8 in the eye diagram. We'll need to calculate several values to get a numeric value for the "width".
We can sum the h[n] values in the unit sample response for channel 1 to get the height of a completed transition:
Σh[n] = 0.1 + 0.2 + 0.3 + 0.4 + 0.5 = 1.5The max "width" happens just one sample into a transition -- the green curve shows a 1-to-0 transition, the blue curve a 0-to-1 transition. The size of the first step in a transition is determined by h[0], which is 0.1. So one sample into a transition the response value of the 1-to-0 transition is (1.5)-(0.1)=1.4 and the response value of the 0-to-1 transition is (0)+(0.1)=0.1.
So the max "width" is difference between these two values: (1.4)-(0.1)=1.3.
In this problem you will be answering questions about a causal linear time-invariant channel characterized by its response to a five-sample pulse, denoted p5[n].
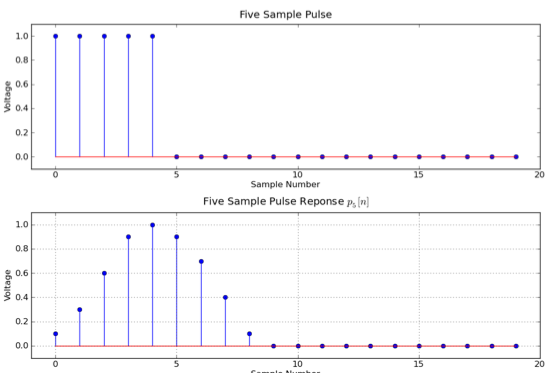
x[n] = pulse[n] + pulse[n-10]We can use superposition to determine the response:
y[n] = p5[n] + p5[n-10]which gives us the following picture:
u[n] = Σk pulse[n - 5k] for k = 0, 1, ..., ∞So that means the unit step response is a scaled, time-shifted sum of p5[n]:
s[n] = Σk p5[n - 5k] for k = 0, 1, ..., ∞Now we can derive an expression for h[n]:
h[n] = s[n] - s[n-1] = Σk (p5[n - 5k] - p5[n - 5k - 1])
Suppose the perfect deconvolving difference equation for a linear time-invariant channel is
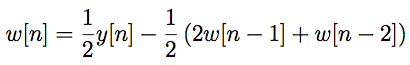
That is, if x[n] is the input to the channel and y[n] is the channel output, in the noise-free case, w[n] will be exactly x[n].
y[n] = 2w[n] + 2w[n-1] + w[n-2]If the deconvolver is perfect, this must be the convolution sum, so we can simply read off the h[n] values as the scaling factors for the w[n]:
h[0] = 2  (the scaling factor for w[n])
h[1] = 2  (the scaling factor for w[n-1])
h[0] = 1  (the scaling factor for w[n-2])
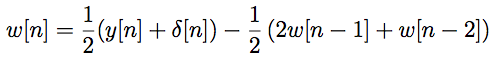
where δ[n] is the unit sample, i.e., it has the value 1 when n=0 and is 0 otherwise. Suppose the input to the channel, x[n], is as plotted below. Please determine the first three values of the deconvolver output, w[0], w[1], and w[2]. Because the calculation of w[0] is corrupted by noise, we no longer expect the deconvolution to exactly reproduce x[n].
x[n] = 1, -1, 1, -1, 0 for n = 0, 1, 2, 3, 4Using the unit sample response computed in part (A) and the convolution sum, we can compute y[n]:
y[n] = 2, 0, 1, -1, -1 for n = 0, 1, 2, 3, 4Now we complete the calculation of w[n] using the equation given above:
w[0] = (0.5)(y[0] + δ[0]) = (0.5)(2 + 1) = 1.5
w[1] = (0.5)(y[1] + δ[1]) - (0.5)(2w[0]) = (0.5)(0 + 0) - (0.5)(2*1.5) = -1.5
w[2] = (0.5)(y[2] + δ[2]) - (0.5)(2w[1] + w[0]) = (0.5)(1 + 0) - (0.5)(2*-1.5 + 1.5) = 1.25
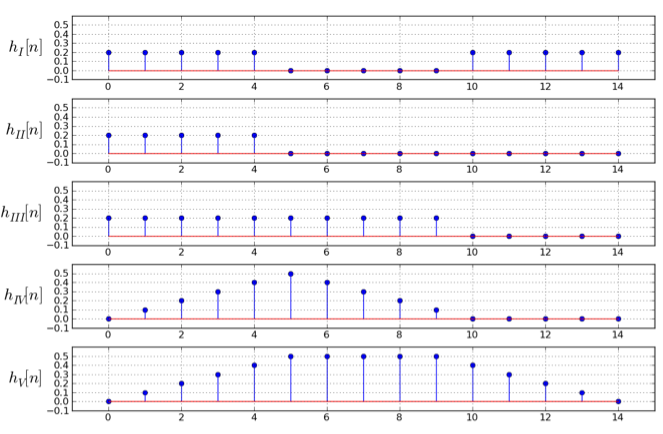
For all parts of this problem, please consider five linear and time-invariant channels, cleverly titled channel I, channelII, channel III, channel IV and channel V. The unit sample response for each of these five channels is plotted below, with the values outside the interval 0 to 14 being zero. Please use these plots to answer all the parts of this problem.
Please note:
s[n] = Σk h[k] for k = 0, 1, ..., nThis gives the following plot:
s[n] = Σk h[k] for k = 0, 1, ..., nAs n → ∞, we'll add up all the non-zero h[n] for each channel to get the value for s[∞]:
sI[∞] = 2
sII[∞] = 1
sIII[∞] = 2
sIV[∞] = 2.5
sV[∞] = 4.5
So the channels are I and III, which both have the final value of 2.
Explanation: since all five channels under consideration have unit sample responses h[n] satisfying the condition h[n] = 0 for n < 0, the channels are causal. Since x[n] equals u[n] (the unit step sequence) for n < 10, y[n] equals the unit step response of the channel for n < 10. Since the increments of the unit step response are the values of the unit sample response, and since the increments of x[n], as shown, are first increasing (until n = 5), and then not decreasing much (until n = 10), the unit sample response of the channel is increasing until n = 5 and then not decreasing much until n = 10, which leaves channel V as the only option.
For channel V, we have
y[15] = h[0]x[15] + h[1]x[14] + ... + h[15]x[0]
      = h[6] + h[7] + ... + h[15]
      = 0.5 + 0.5 + 0.5 + 0.5 + 0.4 + 0.3 + 0.2 + 0.1
      = 3
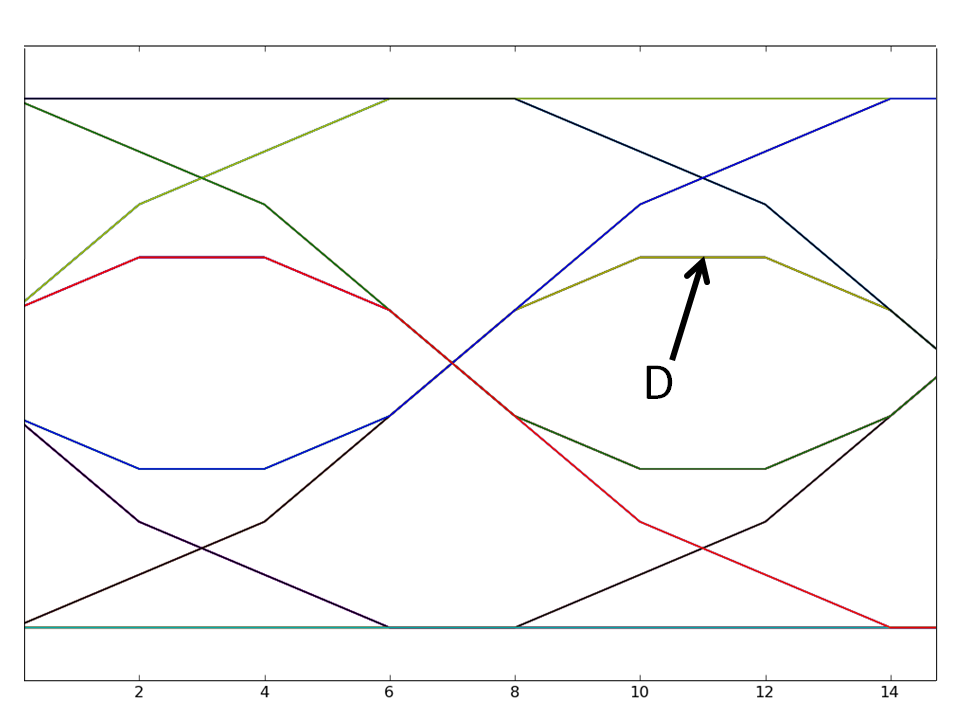
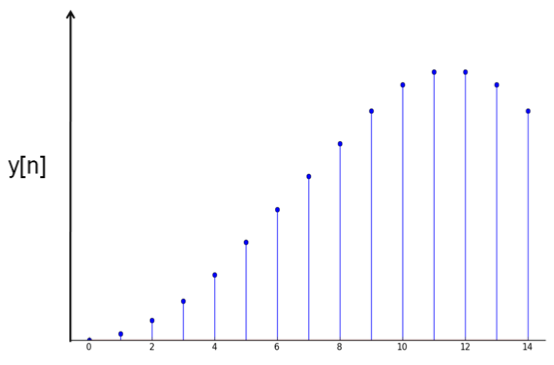
Explanation: since all five channels under consideration have non-negative unit sample responses, the steepest path from the bottom to the top of the eye diagram yields the samples of the unit step response (possibly shifted in time). Thus, the increments of the unit step response have the pattern of increasing for five samples, then decreasing for five samples, which is only matched by channel IV. Hence the top line of the eye diagram corresponds to 2.5 volts. The top of the eye corresponds to the maximal value of the channel response to the input encoding the bit sequence [1, 0], which is encoded as [1, 1, 1, 1, 1, 0, 0, 0, 0]. The response of channel IV to this input is the moving average of 5 consecutive samples of the unit sample response, achieving its maximal value at the sum
hIV[3] + hIV[4] + hIV[5] + hIV[6] + hIV[7] = 0.3 + 0.4 + 0.5 + 0.4 + 0.3 = 1.9.Since all eye diagrams are symmetric with respect to the horizontal line in the middle, the bottom of the eye corresponds to the value 0.6 = 2.5 - 1.9. Hence the eye width is 1.9 - 0.6 = 1.3.
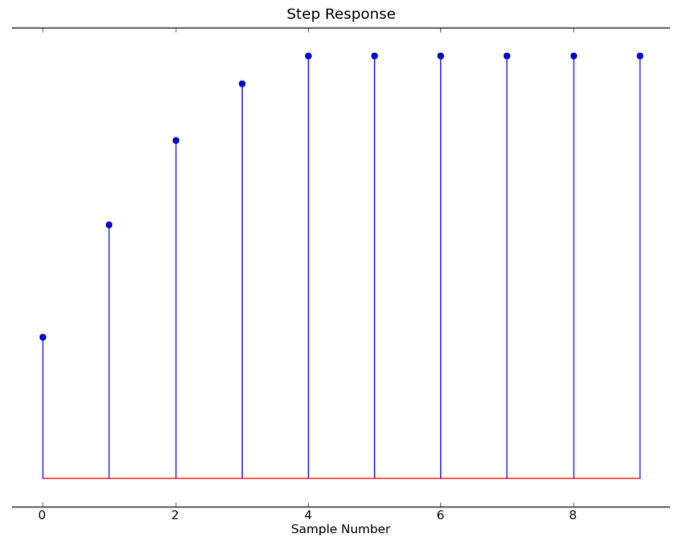
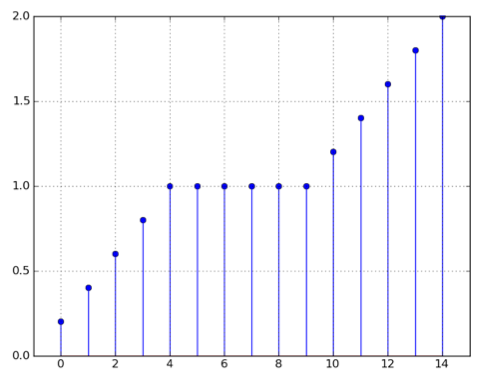
The unit step response of a particular channel is shown below:
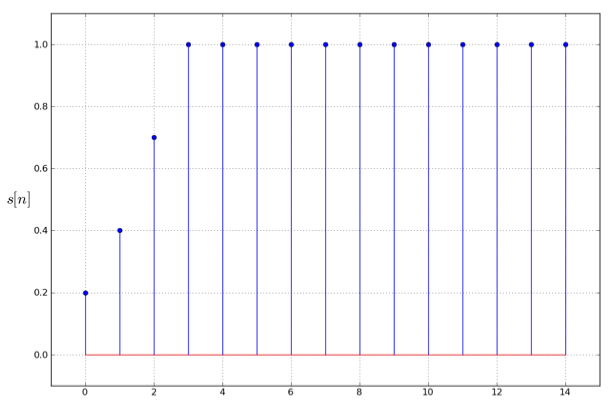
Note: all the voltage values in the step response plot are integer multiples of 0.1 volt.
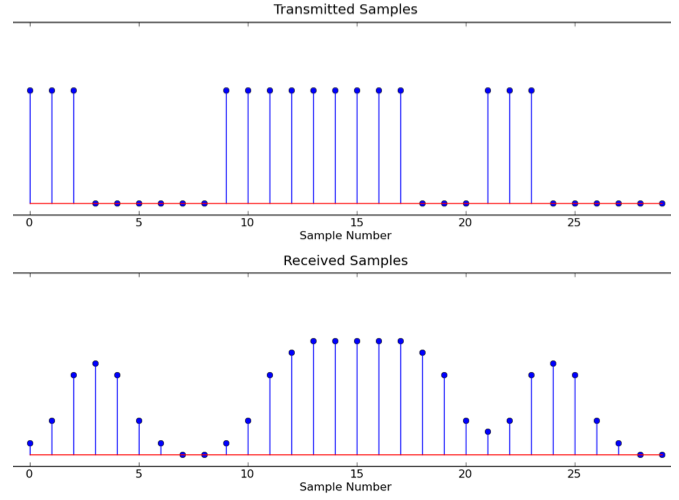
n:     0  1  2  3  4  5  6  7  8  9 10 11 12 13 14 15 16 17 18 19 20 21 22 23 24
x[n]:  0  0  0  0  0  0  0  0  1  1  1  1  1  1  1  1  0  0  0  0  1  1  1  1  0
Next we can determine h[n] by computing s[n] - s[n-1], reading the values of s[n] from the diagram above:
n:        0   1   2   3   4   5
s[n]:    0.2 0.4 0.7 1.0 1.0 1.0 ...
s[n-1]:  0.0 0.2 0.4 0.7 1.0 1.0 ...
h[n]:    0.2 0.2 0.3 0.3  0   0  ...
Now we can determine y[24] using the convolution sum, keeping only the non-zero terms of h[n]:
y[24] = x[24]h[0] + x[23]h[1] + x[22]h[2] + x[21]h[3]
      = (0)(0.2) + (1)(0.2) + (1)(0.3) + (1)(0.3)
      = 0.8

Assume that wA[n] = 0 for n < 0. For what value of α will wA[n] = x[n] where x[n] is the input to the channel?
y[n] = x[n]*0.2 + x[n-1]*0.2 + x[n-2]*0.3 + x[n-3]*0.3Reorganizing the deconvolver expression for y[n]:
y[n] = wA[n]*α + wA[n-1]*0.2 + wA[n-2]*0.3 + wA[n-3]*0.3If we want wA[n] = x[n] then α must be 0.2.