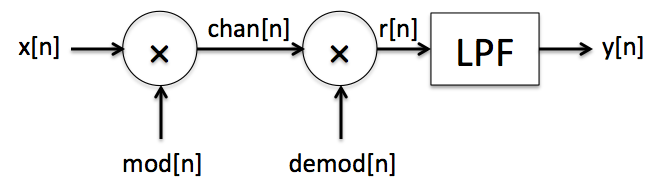
Here's our "standard" modulation-demodulation system diagram:
at the transmitter, signal x[n] is modulated by signal mod[n] and
the result (chan[n]) to the receiver where the incoming signal
is demodulated by demod[n] and sent through a low-pass filter
to produce y[n].
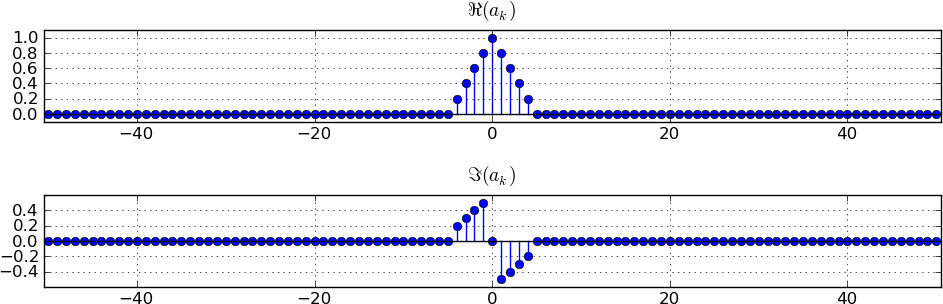
Suppose the band-limited signal x[n] has the spectral coefficients
shown below, where N=101:
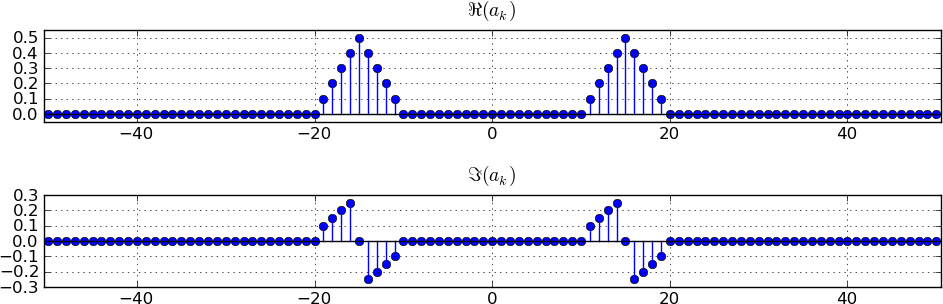
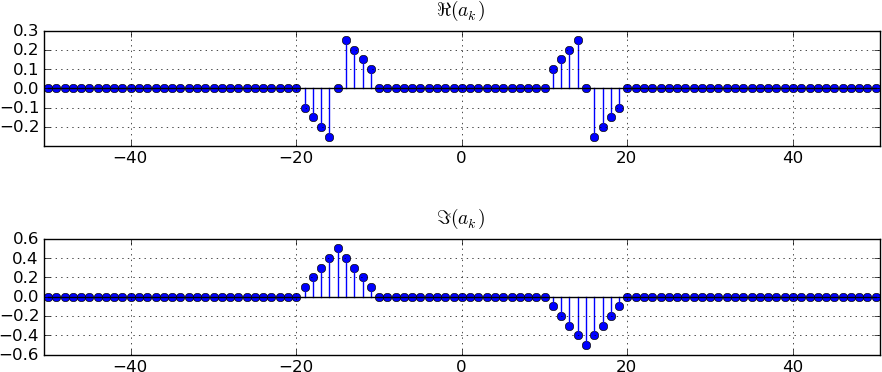
Let mod[n] = cos(15(2π/101)n). Sketch a plot of the spectral
coefficients for chan[n], showing both the real and imaginary
components. Please label center frequencies and peak amplitudes.
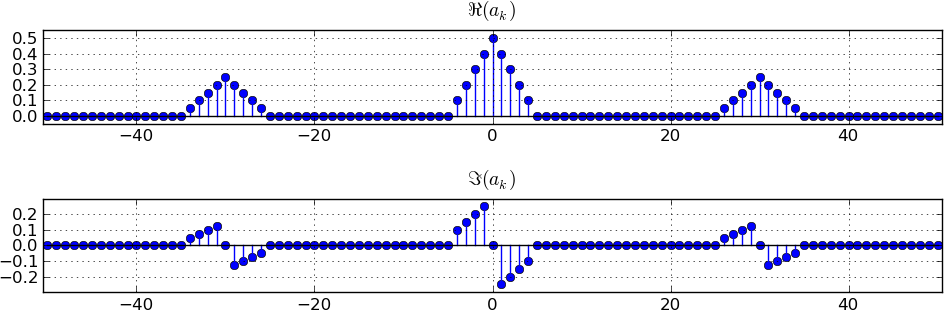
Let demod[n] = cos(15(2π/101)n), i.e., a sinusuoid of the
same frequency and phase as mod[n]. Sketch a plot of the spectral
coefficients for r[n], showing both the real and imaginary
components. Please label center frequencies and peak amplitudes.
Note how the waveforms around frequency 0 are added together to
produce a center component that's twice the height of the two
side components.
Give the appropriate cutoff frequency and gain for the low-pass
filter LPF so that y[n] is identical to x[n].
The low-pass filter should have a gain of 2 and a cutoff frequency
that equals the bandwidth of x[n], i.e., k = ±5.
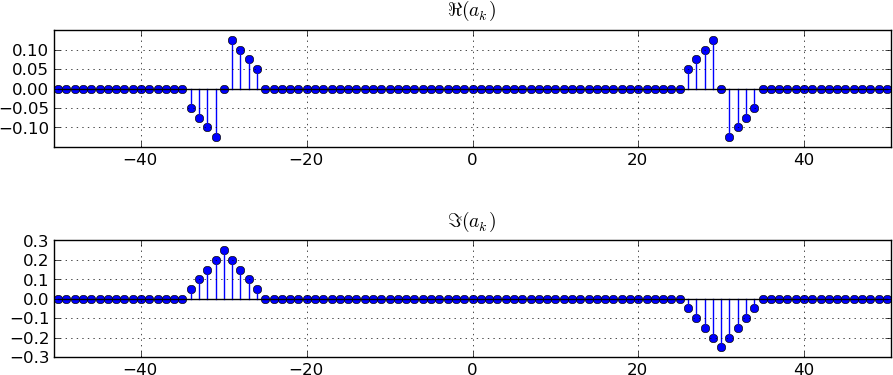
Let mod[n] = sin(15(2π/101)n), i.e., like part (A) except
the modulating signal is a sine instead of a cosine. Sketch a plot of
the spectral coefficients for chan[n], showing both the real and
imaginary components. Please label center frequencies and peak
amplitudes.
Note how the real and imaginary parts have been interchanged.
Let demod[n] = cos(15(2π/101)n), i.e., a sinusuoid of the
same frequency and but π/2 out of phase with mod[n]. Sketch a plot of the spectral
coefficients for r[n], showing both the real and imaginary
components. Please label center frequencies and peak amplitudes.
Note how the real and imaginary parts have been interchanged.
Assuming the parameters of the LPF are set as determined
in part (C), describe y[n].
y[n] = 0. Demodulating with a signal that's π/2 out of phase
with the modulating signal produces destructive adding around
frequency 0, so the signal in that region has zero amplitude.
Problem .
Single-sideband (SSB) modulation is a modulation technique designed to
minimize the amount of footprint used to transmit an amplitude
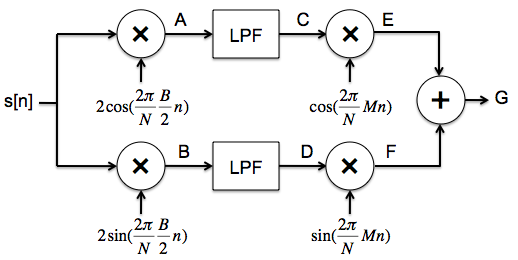
modulated signal. Here's one way to implement an SSB transmitter.
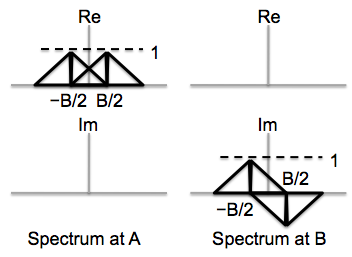
Starting with a band-limited signal s[n], modulate it
with two carriers, one phase shifted by π/2 from the other. The
modulation frequency is chosen to be B/2, i.e., in the middle of the
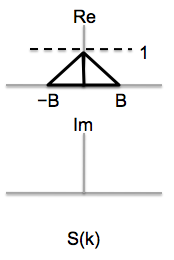
frequency range of the signal to be transmitted. Sketch the real and
imaginary parts of the Fourier coefficients for the signals at points
A and B. The figure below shows the Fourier coefficients for the
signal s[n].
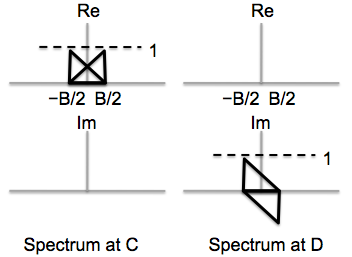
The modulated signal is now passed through a low-pass filter
with a cutoff frequency of B/2. Sketch the real and imaginary parts of
the Fourier coefficients for the signals at points C and D.
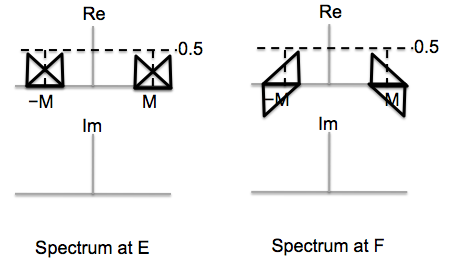
The signal is modulated once again to shift it up to the
desired transmission frequency. Sketch the real and imaginary parts
of the Fourier coefficients for the signals at points E and F.
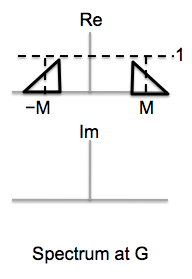
Finally the two signals are summed to produce the signal to be sent over
the air. Sketch the real and imaginary parts of the Fourier coefficients for the
signal at point G.
Problem .
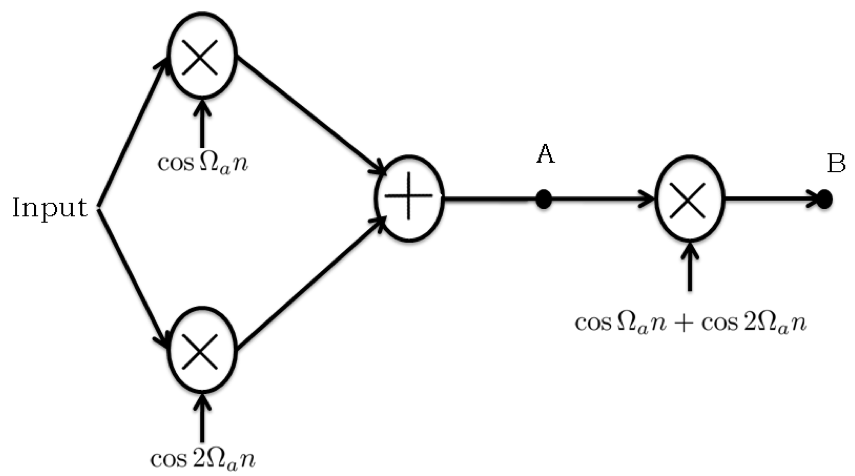
Consider the simple modulation-demodulation system below, where all
signals are assumed periodic with period N = 10000 and the sampling
frequency, fs, is 10000 samples per second. In addition,
Ωa = 2π(fa/fs) = (1000*2π)/10000.
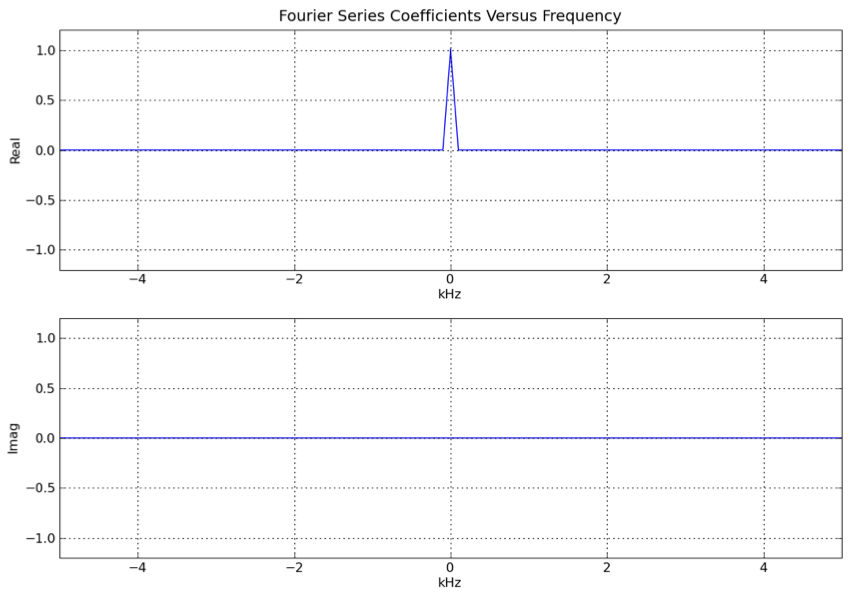
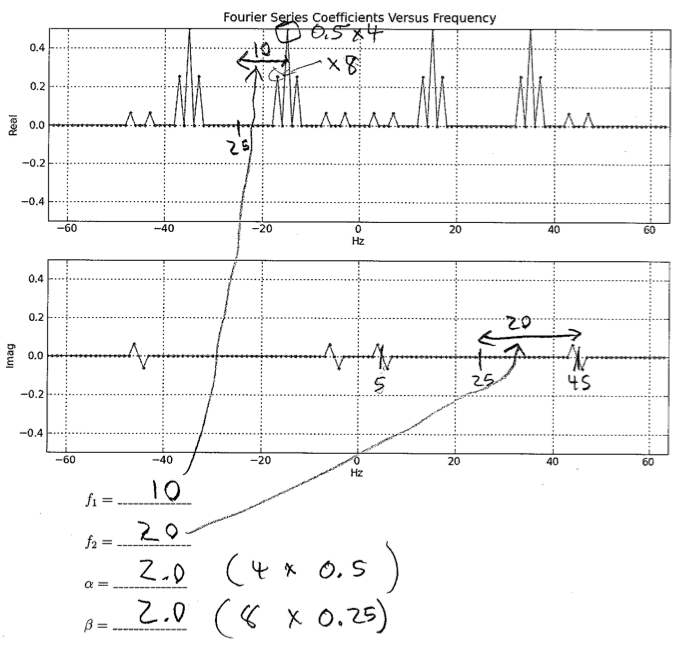
The Fourier Series coefficients versus frequency for the input to the
modulation-demodulation system are plotted below for the case N=10000
and fs=10000. Note that the Fourier coefficients are nonzero only for
-100 ≤ k ≤ 100.
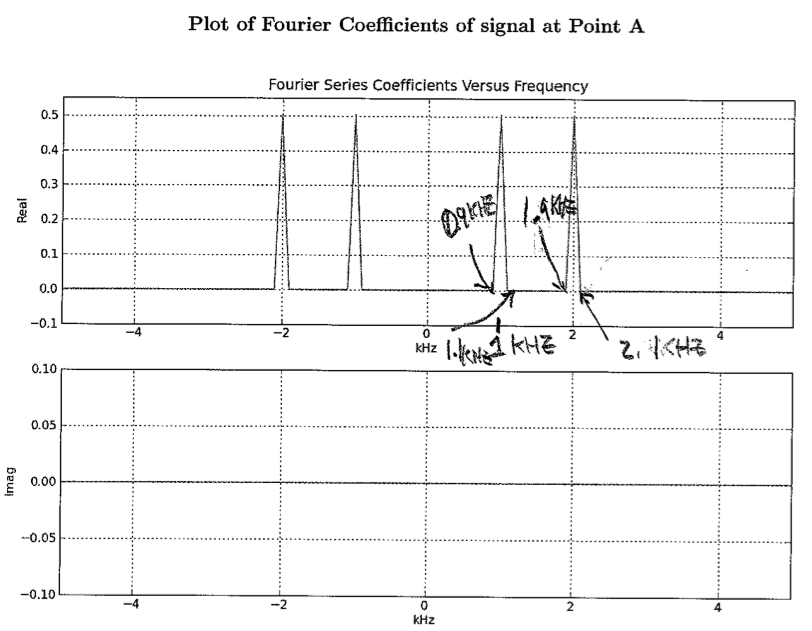
Please plot the Fourier series coefficients versus frequency for
the signals at location A and B in the above diagram. Be sure to label
key features such as values and coefficient indices for peaks.
Problem .
In this modulation problem you will be examining periodic signals
and their associated discrete-time Fourier series (DTFS)
coefficients. Recall that a periodic signal x[n] with period N has DTFS
coefficients given by
ak = (1/N)Σn=<N>x[n]e-jk(2π/N)n
and that the signal x[n] can be reconstructed from the DTFS coefficients using
x[n] = Σk=<N>akejk(2π/N)n
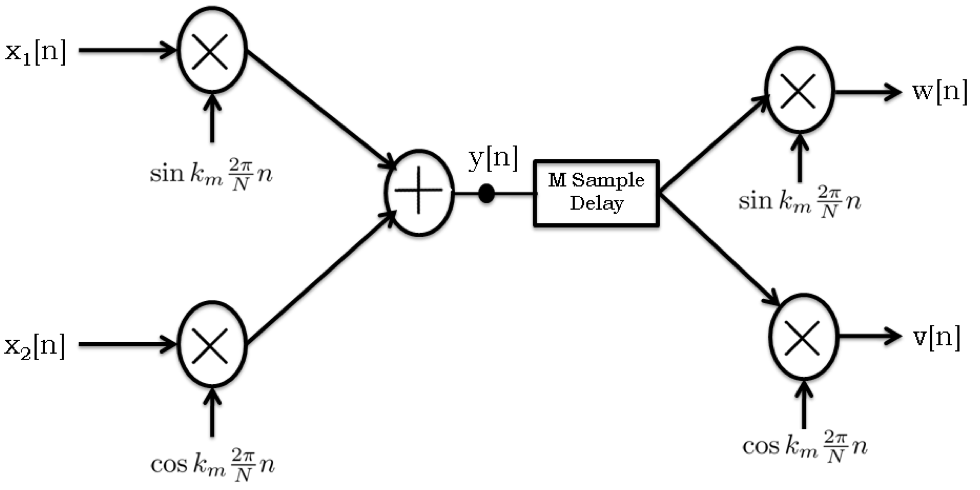
All parts of this question pertain to the following
modulation-demodulation system, where all signals are periodic with
period N = 10000. Please also assume that the
sample rate associated with this system is 10000 samples per second,
so that k is both a coefficient index and a frequency. In the diagram,
the modulation frequency, km, is 500.
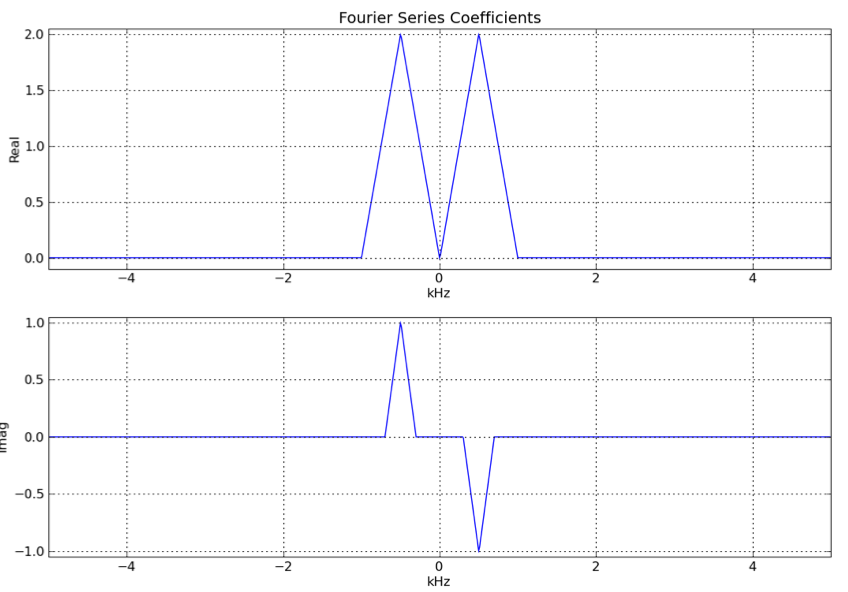
Suppose the DTFS coefficients for the signal y[n] in the
modulation/demodulation diagram are as plotted below.
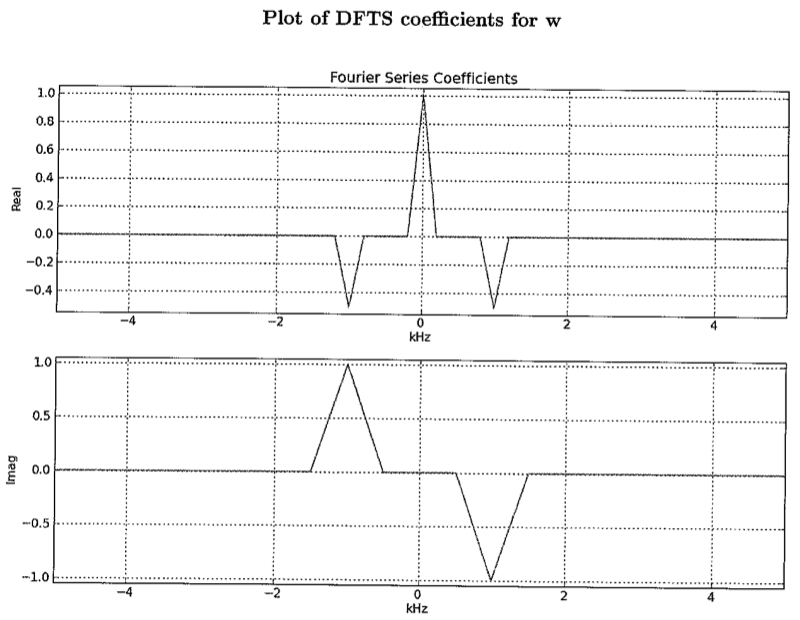
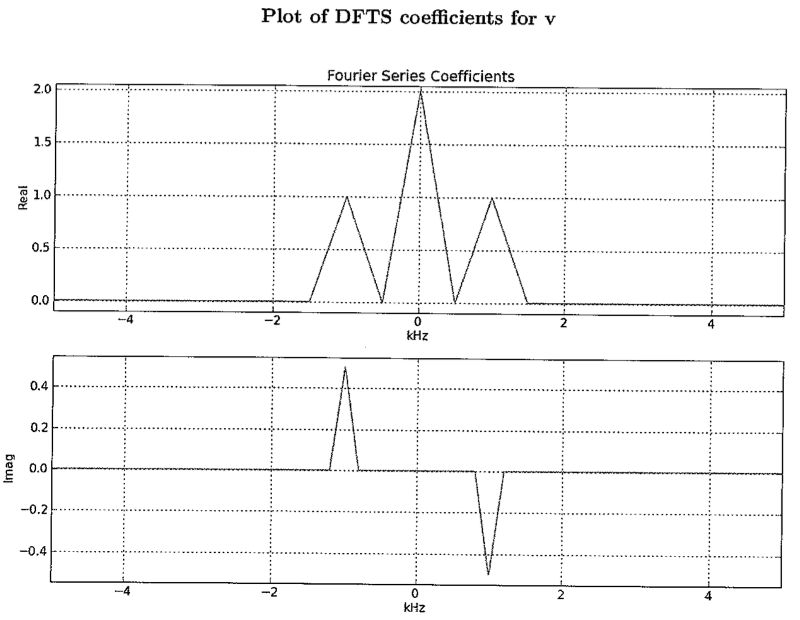
Assuming that M = 0 for the M-sample delay (no delay), please plot
the DTFS coefficients for the signals w and v in the
modulation/demodulation diagram. Be sure to label key features such as
values and coefficient indices for peaks.
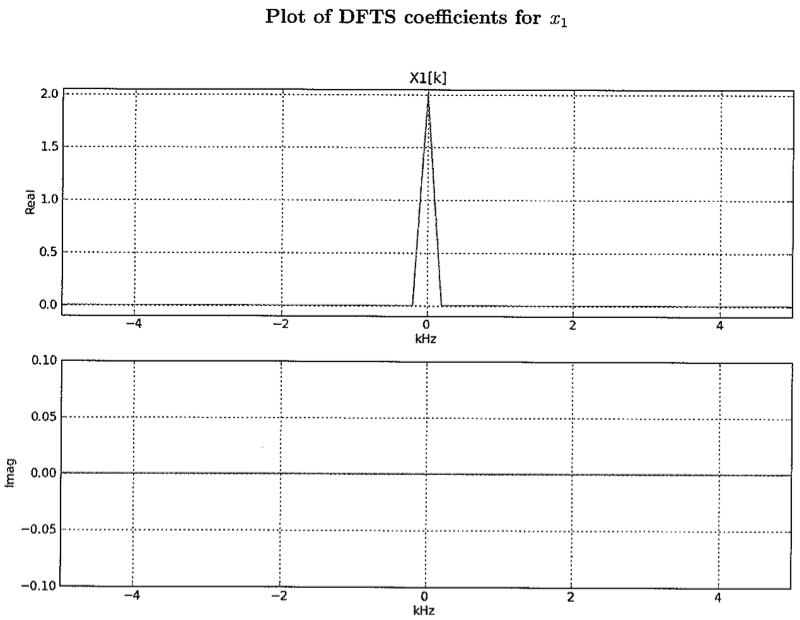
Assuming the DTFS coefficients for the signal y[n] are the same
as in part A, please plot the DTFS coefficients for
the signal x1 in the modulation/demodulation diagram. Be sure to
label key features such as values and coefficient indices for peaks.
For the record, here are the coefficients for x2[n]:
If the M-sample delay in the modulation/demodulation diagram
has the right number of samples of delay, then it will be possible to
nearly perfectly recover x1[n] by low-pass filtering v[n]. Please
determine the smallest positive number of samples of delay that are
needed and the cut-off frequency for the low-pass filter. Please be sure
to justify your answer.
We want to choose M such that
sin(km(2π/N)(n-M)) ≈ cos(km(2π/N)n)
i.e., M samples of delay should introduce a phase shift of +π/2,
or, equivalently, -3π/2:
-3π/2 = 500(2π/10000)(-M) = (-M)π/10
So if M = 15 we get the desired result. Looking at the imaginary part
of the plot in part (A), which shows x1[n] modulated by sin(...),
we see that the bandwidth of x is 250 kHz.
Note that if M=5, the phase shift is -π/2, which produces -cos(...),
which we can convert to cos(...) if the LPF has a gain of -1.
Problem .
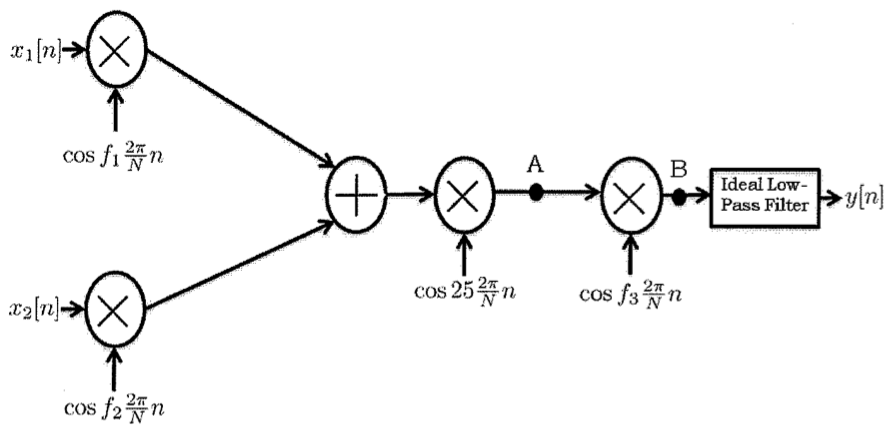
In answering this question, please refer to the modulation-demodulation
system diagrammed below. Assume the N=128 and that the sampling frequency,
fs, is 128 samples per second.
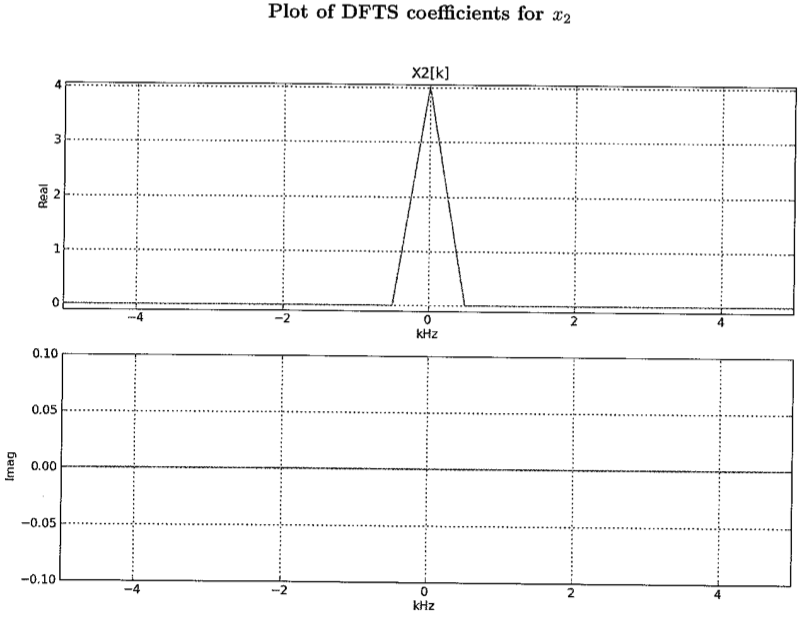
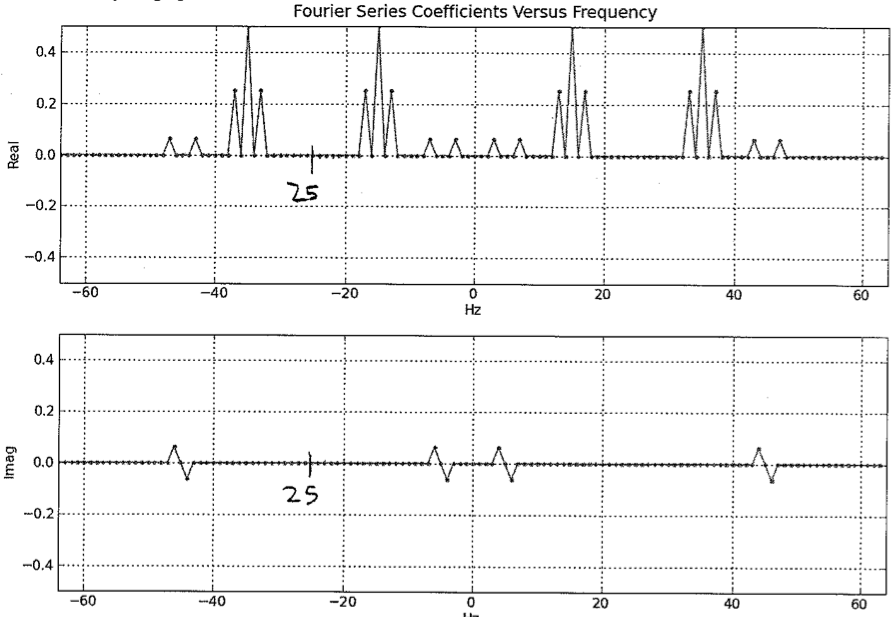
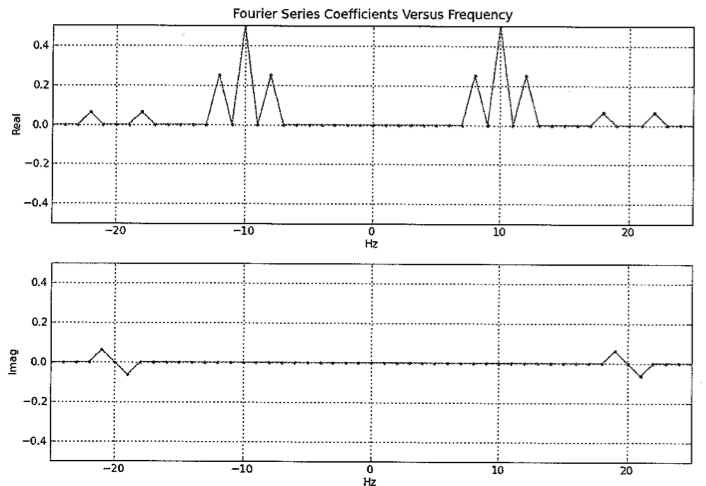
Below are the plots of the real and imaginary parts of the
Fourier coefficients vs. frequency for point A of the
modulation-demodulation diagram. Please plot the real and imaginary
parts of the Fourier coefficients vs. frequency for the signal at
point B, assuming f3 = 25. You only need to plot the Fourier
coefficents in the range -25 to 25. Please be sure to label critical
frequencies and values in your graph.
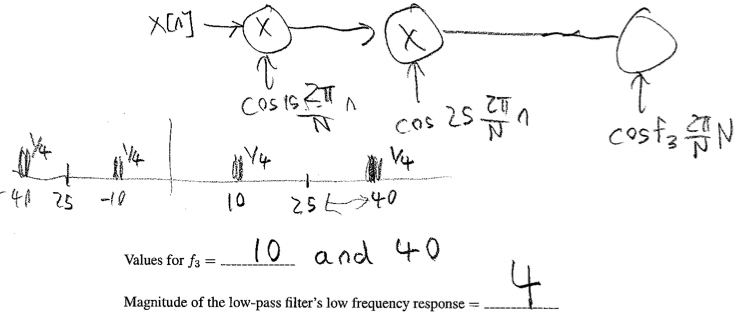
and f1 = 15 (not one of the answers to part B!). For what
values of f3 < 64 (there is more than one) will y[n] =
x1[n], assuming that the low-pass filter has been designed
correctly? In addition, what should the magnitude be for
the low frequency response of the low-pass filter?