

The input sequence to a linear time-invariant (LTI) system is given by
and the output of the LTI system is given by
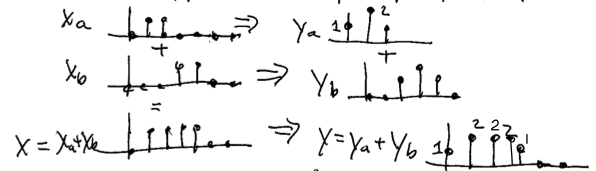
So y = 1, 2, 2, 2, 1, 0, 0, ... when n ≥ 0, 0 otherwise.
Determine the output y[n] for a system with the input x[n] and unit-sample response h[n] shown below. Assume h[n]=0 and x[n]=0 for any times n not shown.
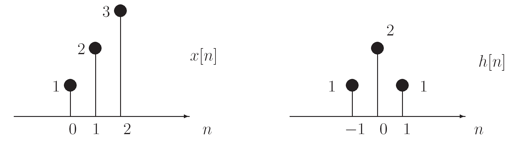
y[n] = Σx[k]h[n-k] = x[0]h[n] + x[1]h[n-1] + x[2]h[n-2]
     = δ[n+1] + 4δ[n] + 8δ[n-1] + 8δ[n-2] + 3δ[n-3]
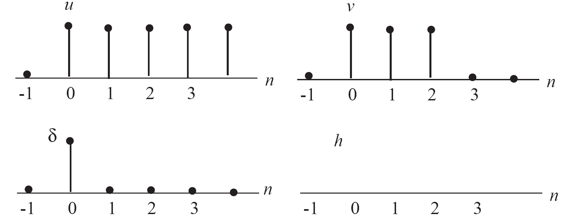
δ[n] = u[n] - u[n-1]
Since the system is linear we can compute the response of the system to the input δ[n] using the superposition of the appropriately scaled and shifted v[n]:
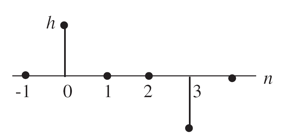
h[n] = v[n] - v[n-1]
The result is shown in the figure below:
Problem .
The output of a particular communication channel is given by
y[n] = αx[n] + βx[n-1] where α > β
It's easy to verify both properities given the channel response above, so the channel is linear.
To be time invariant the channel must have the property that if we shift the input by some number of samples s, the output also shifts by s samples. Again that property is easily verified given the channel response above, so the channel is time invariant.
Using the channel response given above, the channel's unit-sample reponse can be computed as
h[0]=α,
h[1]=β,
h[n]=0 for all other values of n
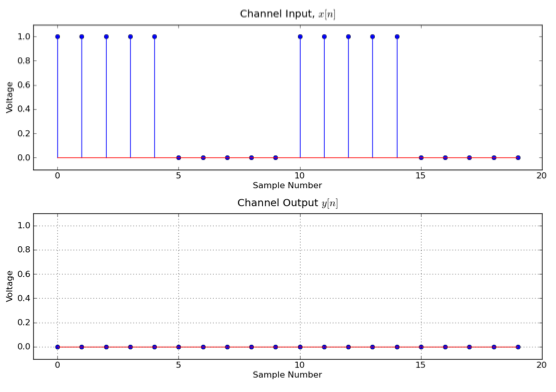
x[n] = [1, 0, 0, 1, 1, 0, 1, 1], followed by all 1's.
then what is the channel's output assuming α=.7 and β=.3?
y[n] = [.7, .3, 0, .7, 1, .3, .7, 1], followed by all 1's.
y[n] = [.7, 1, 1, .3, .7, 1, .3, 0], followed by all 0's.
w[n] = (1/h[0])(y[n] - h[1]w[n-1]) = y[n]/.7 - (.3/.7)w[n-1]
so
w[n] = [1, 1, 1, 0, 1, 1, 0, 0], followed by all 0's
Problem .
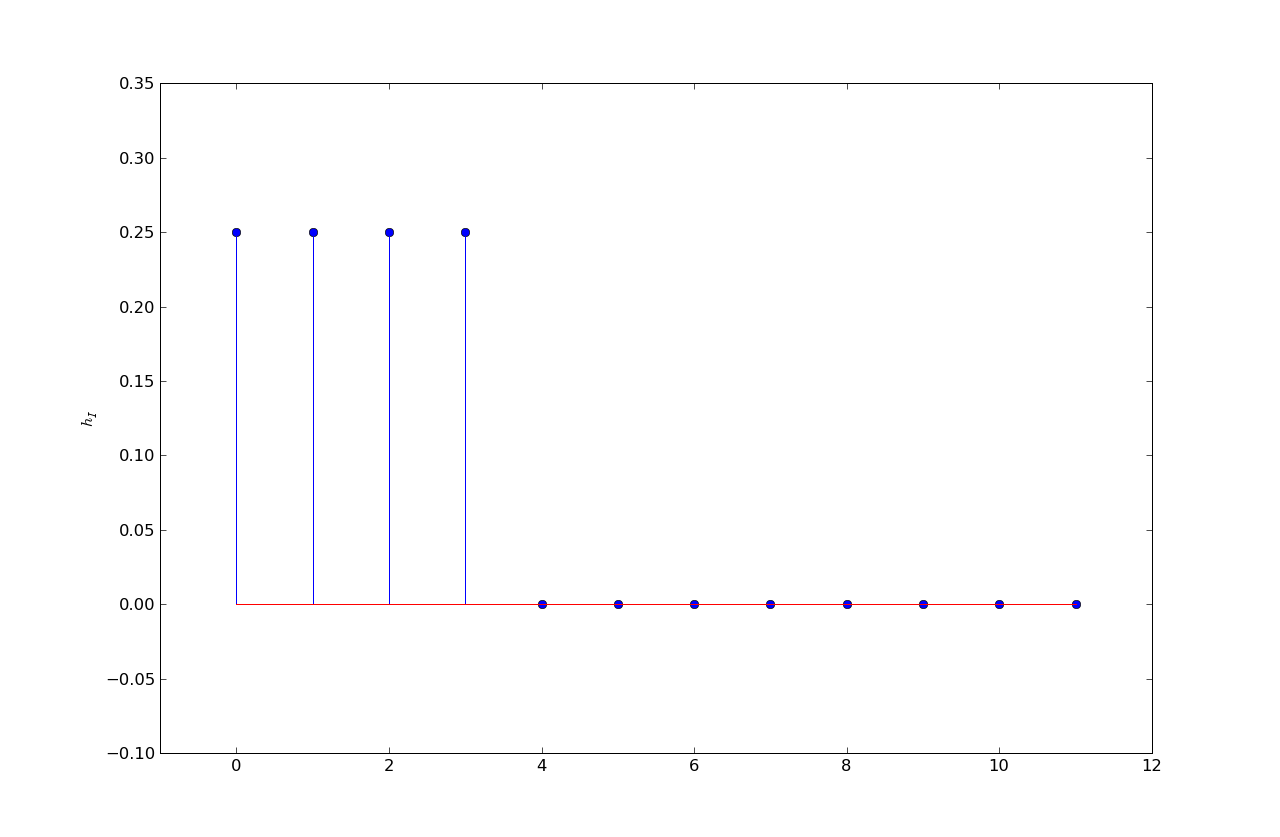
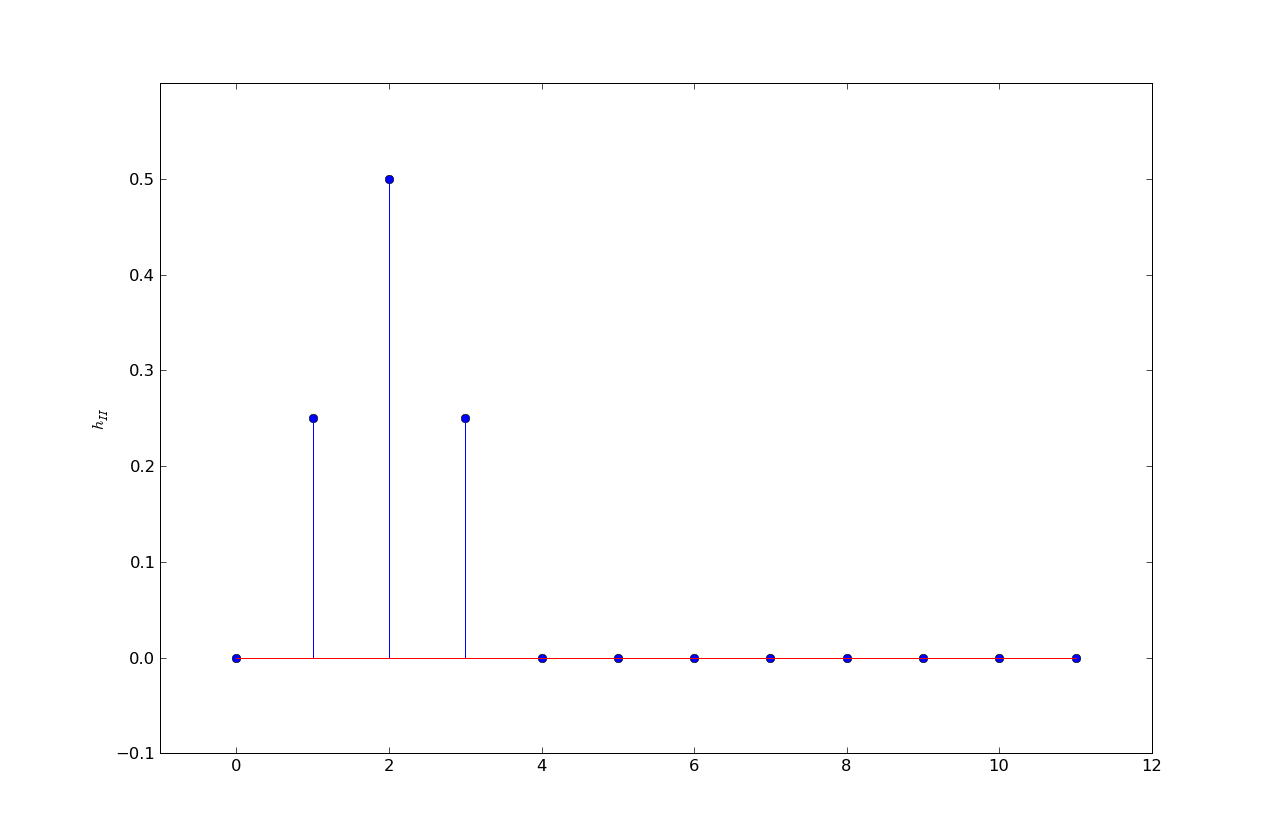
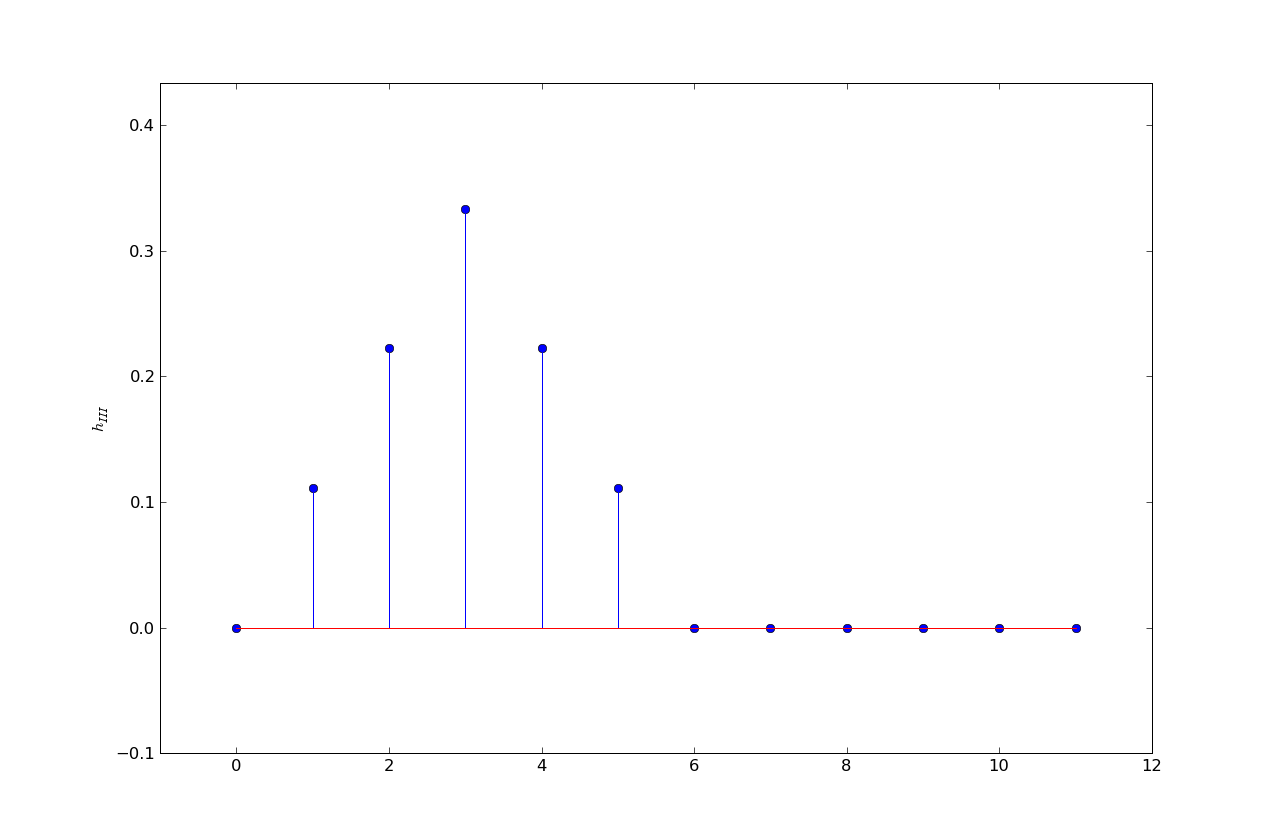
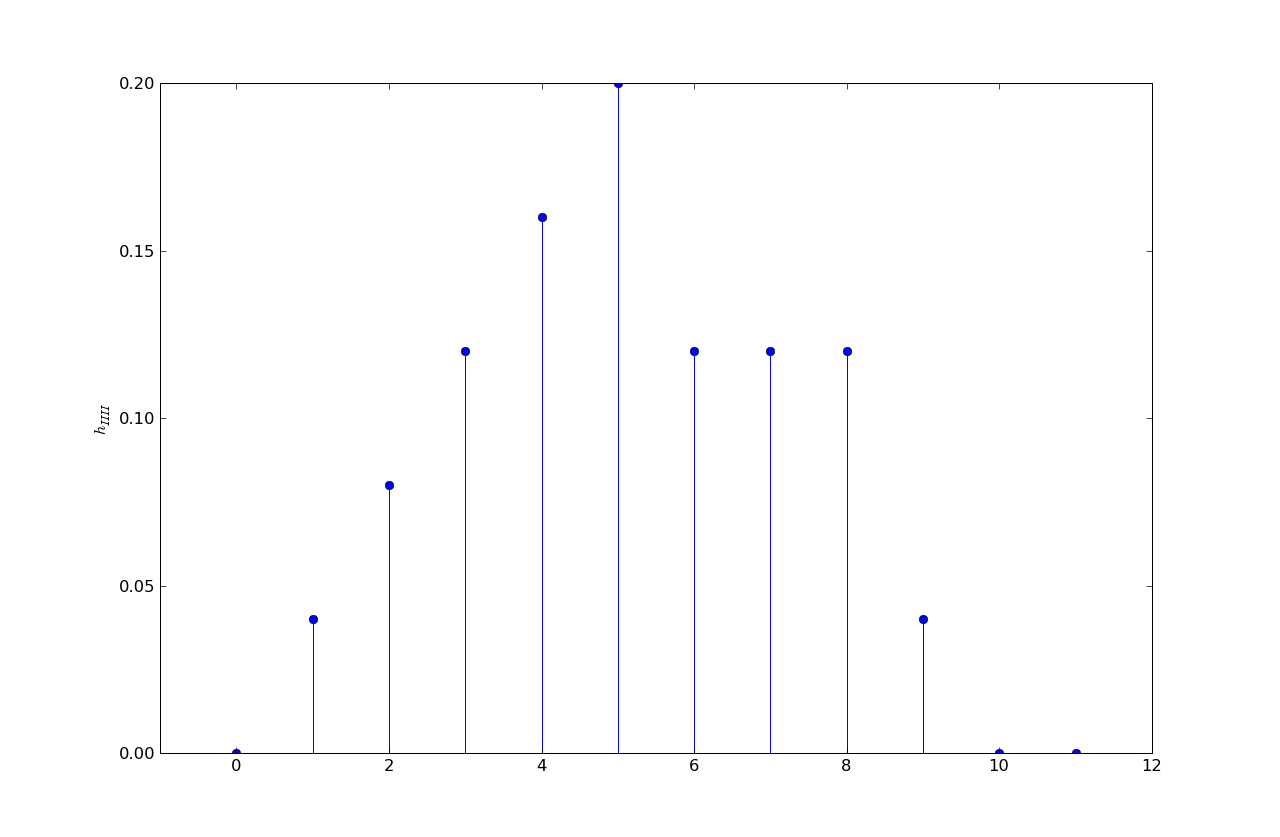
Suppose four different channels {I,II,III,IIII} have four different unit sample responses:
h1 = .25, .25, .25, .25, 0, ...
h2 = 0, .25, .5, .25, 0, ...
h3 = .11, .22, .33, .22, .11, 0, ...
h4 = .04, .08, .12, .16, .20, .12, .12, .12, .04, 0, ...
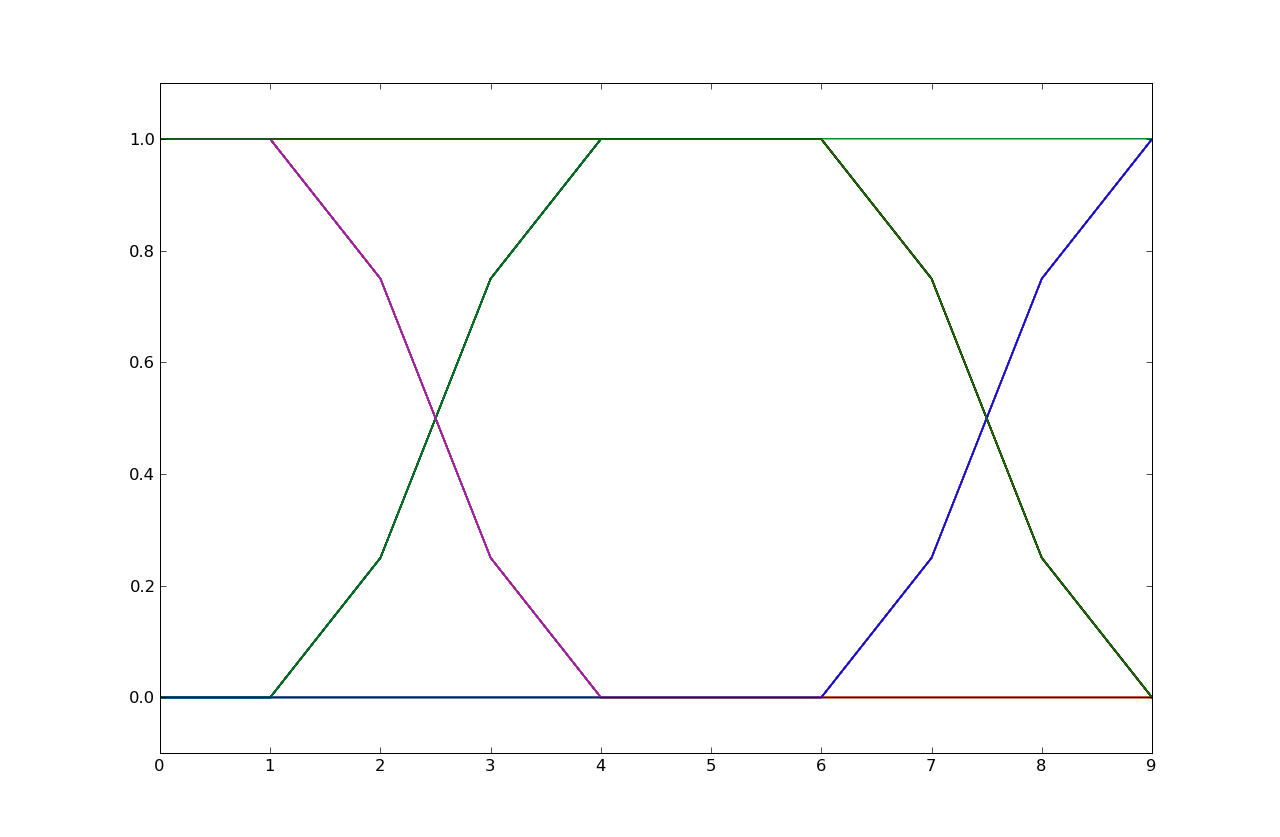
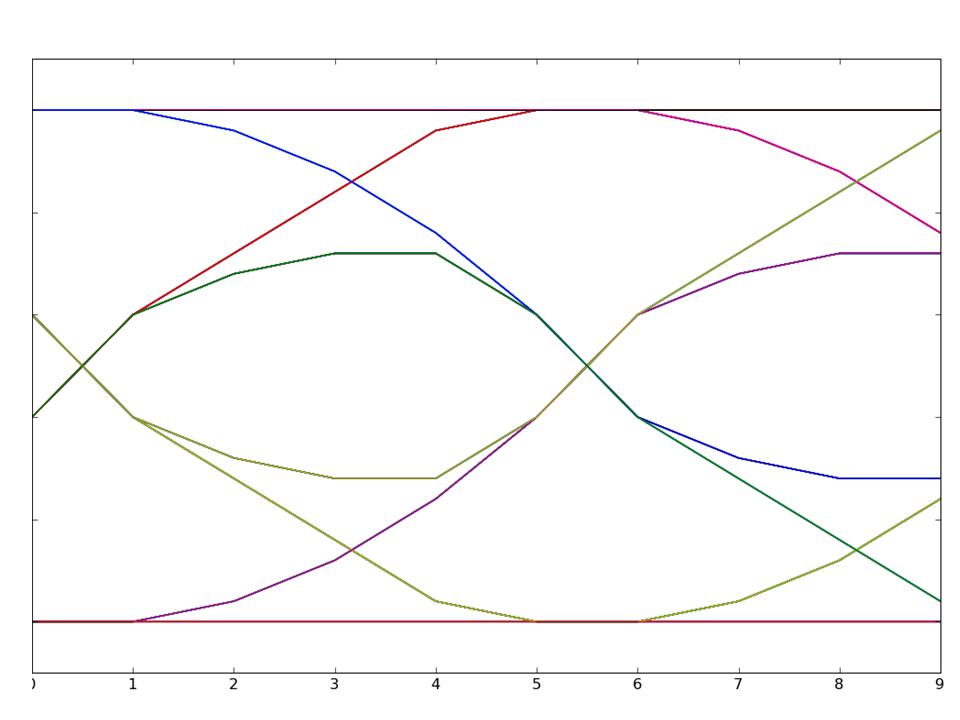
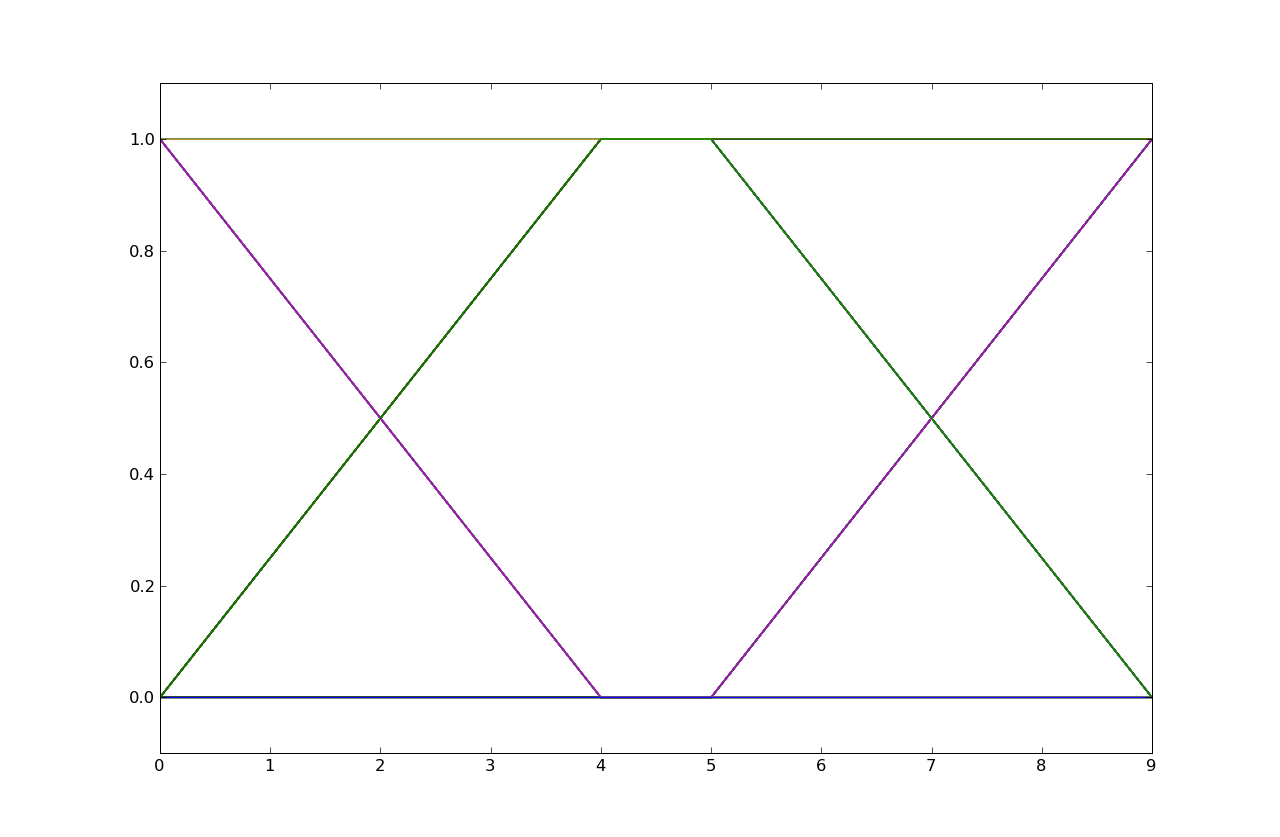
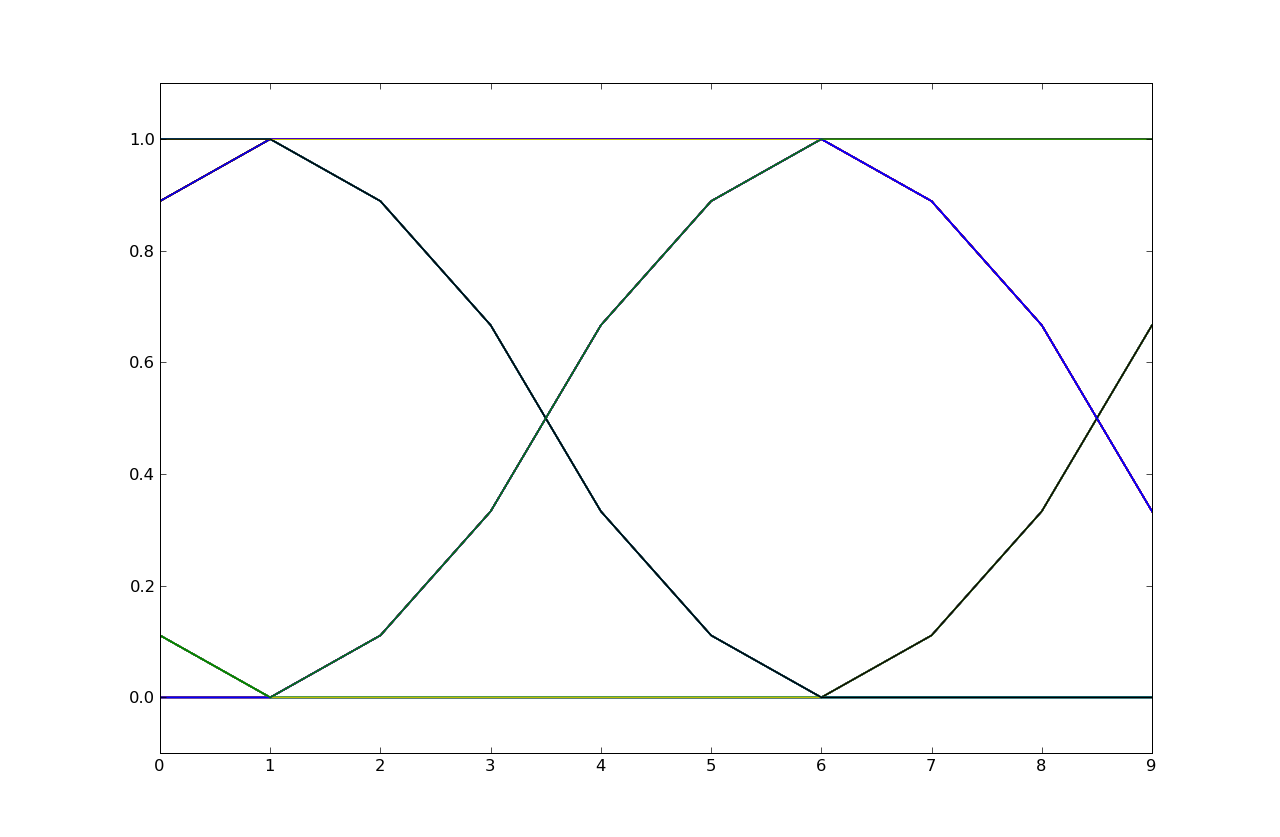
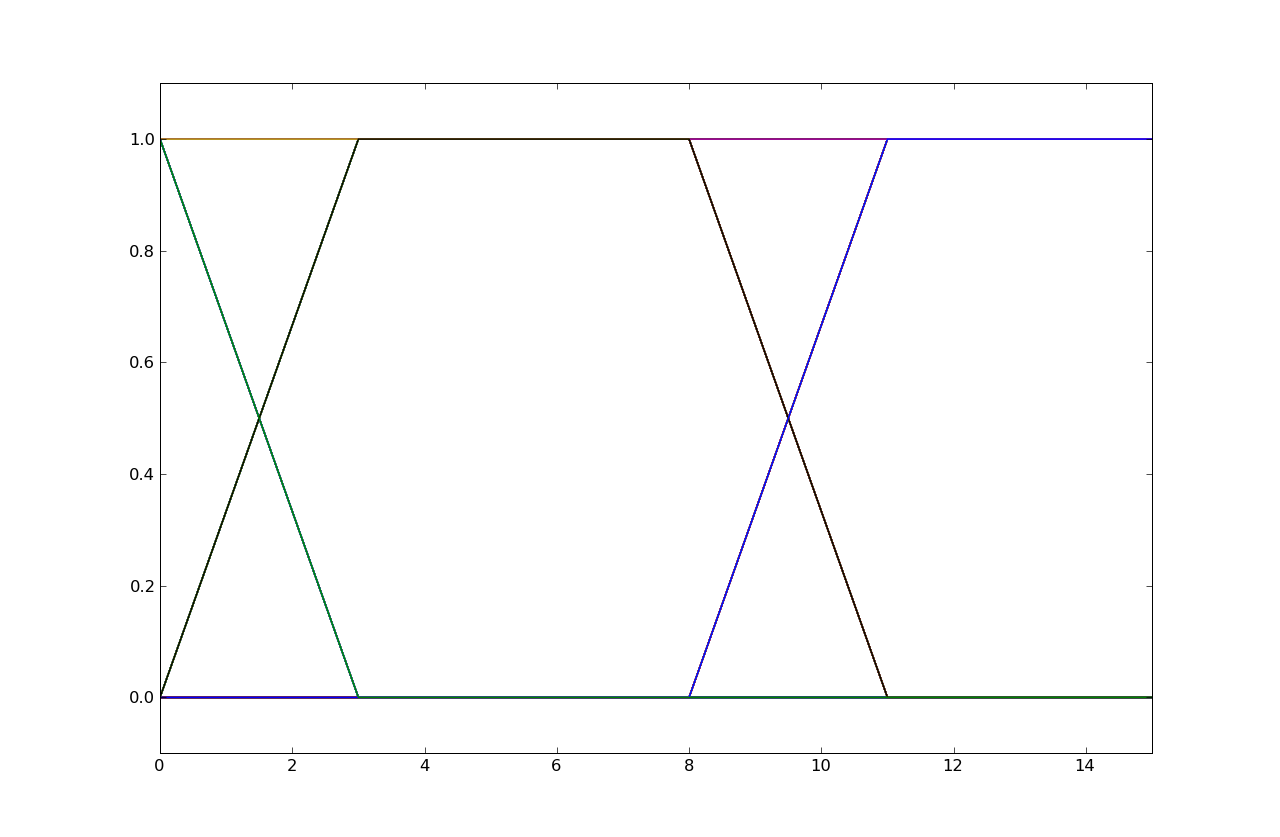
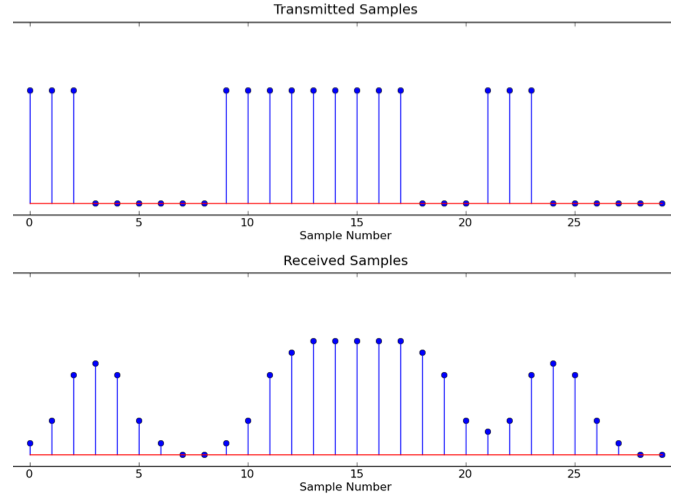
Each of the following eye diagrams is associated with transmitting bits using one of the four channels, where five samples were used per bit. That is, a one bit is five one-volt samples and a zero bit is five zero-volt samples. Please determine which channel was used in each case.
Problem .
This question refers to the LTI systems, I, II and III, whose unit-sample responses are shown below:
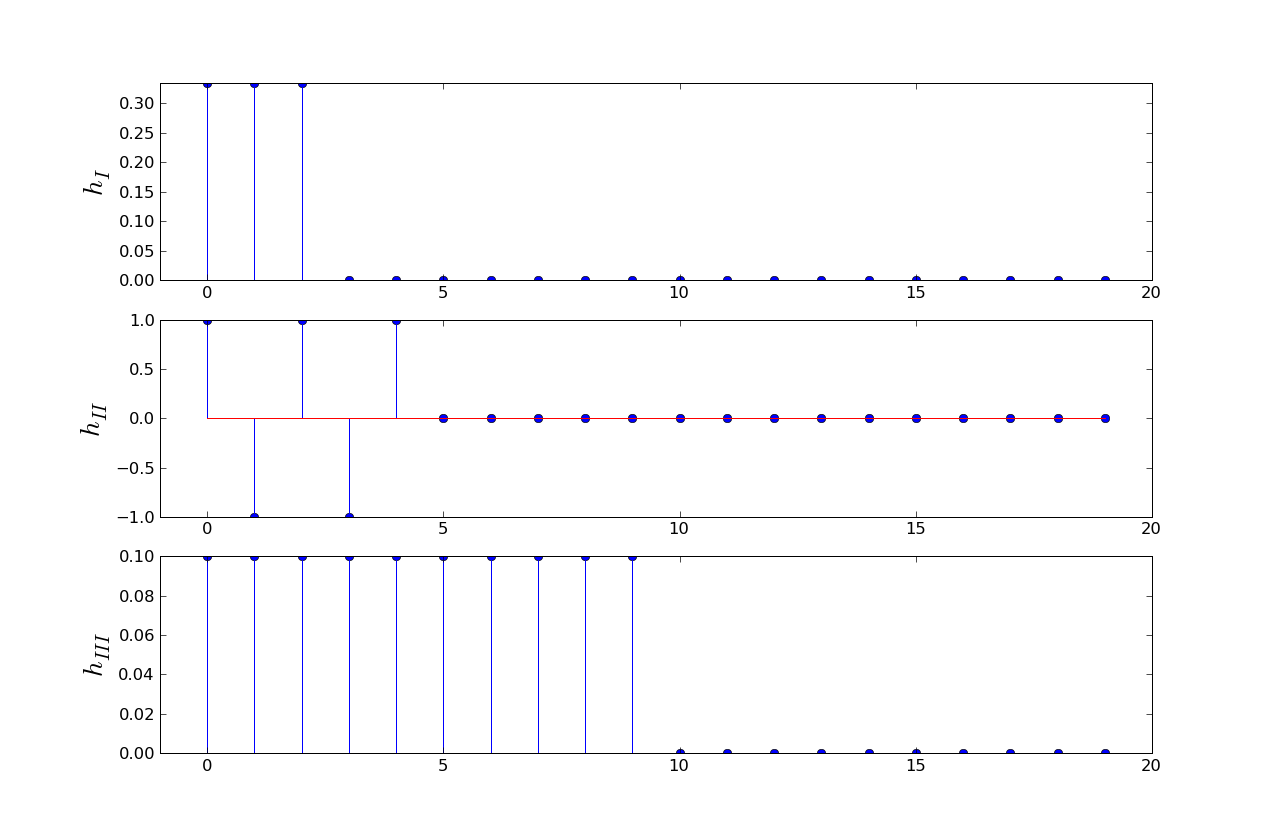
In this question, the input to these systems are bit streams with eight voltage samples per bit, with eight one-volt samples representing a one bit and eight zero-volt samples representing a zero bit.
Suppose a linear time-variant channel has a unit sample response given by
h[n] = 1/2  n = 0, 1, 2
h[n] = 0    otherwise
If the input to the channel is
x[n] = 3/2  n = 2, 3, 4
x[n] = 0    otherwise
please determine the maximum value of the output of the channel and the index at which that maximum occurs.
y[n] = x[n]h[0] + x[n-1]h[1] + x[n-2]h[2]and three non-zero x[n] values, all positive. So the maximum value of y[n] occurs when using all three x[n] values:
y[4] = x[4]h[0] + x[3]h[1] + x[2]h[2]
     = (3/2)(1/2) + (3/2)(1/2) + (3/2)(1/2)
     = 9/4
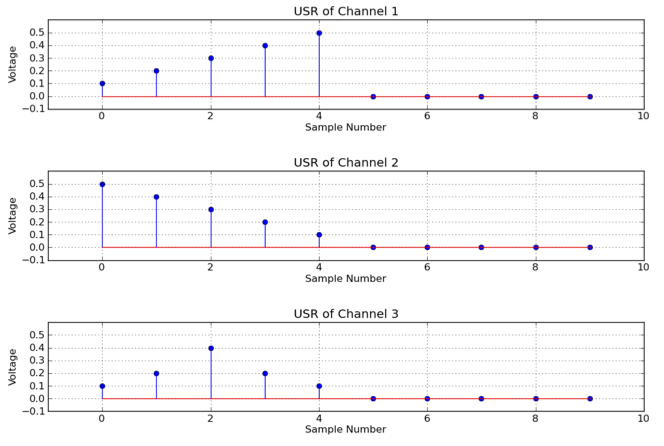
For this problem, please consider three linear and time-invariant channels, channel one, channel two, and channel three. The unit sample response for each of these three channels are plotted below. Please use these plots to answer all the parts of this question.
The maximum value happens after the transition is complete, so we just need to sum all the h[n] values:
Σh[n] = 0.5 + 0.4 + 0.3 + 0.2 + 0.1 = 1.5
Using the convolution sum and noticing that h[m] = 0, m ≥ 5:
y[24] = x[24]h[0] + x[23]h[1] + x[22]h[2] + x[21]h[3] + x[20]h[4]
      = (0)(0.1) + (1)(0.2) + (1)(0.4) + (1)(0.2) + (0)(0.2)
      = 0.2 + 0.4 + 0.2
      = 0.8
In this problem you will be answering questions about a causal linear time-invariant channel characterized by its response to a five-sample pulse, denoted p5[n].
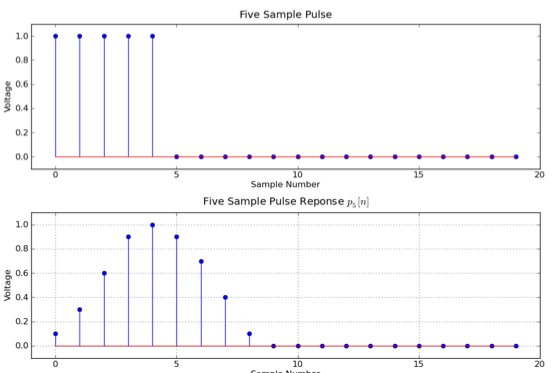
x[n] = pulse[n] + pulse[n-10]We can use superposition to determine the response:
y[n] = p5[n] + p5[n-10]which gives us the following picture:

u[n] = Σk pulse[n - 5k] for k = 0, 1, ..., ∞So that means the unit step response is a scaled, time-shifted sum of p5[n]:
s[n] = Σk p5[n - 5k] for k = 0, 1, ..., ∞Now we can derive an expression for h[n]:
h[n] = s[n] - s[n-1] = Σk (p5[n - 5k] - p5[n - 5k - 1])
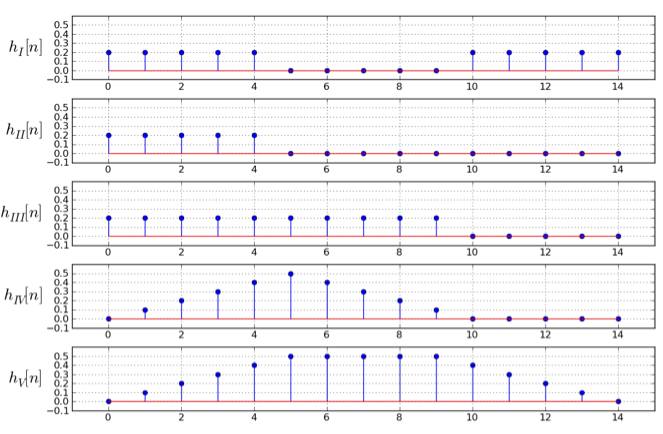
For all parts of this problem, please consider five linear and time-invariant channels, cleverly titled channel I, channelII, channel III, channel IV and channel V. The unit sample response for each of these five channels is plotted below, with the values outside the interval 0 to 14 being zero. Please use these plots to answer all the parts of this problem.
Please note:
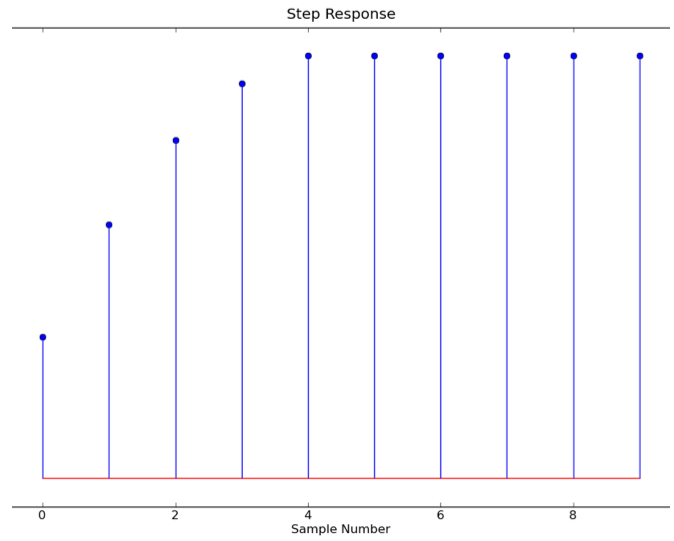
s[n] = Σk h[k] for k = 0, 1, ..., nThis gives the following plot:
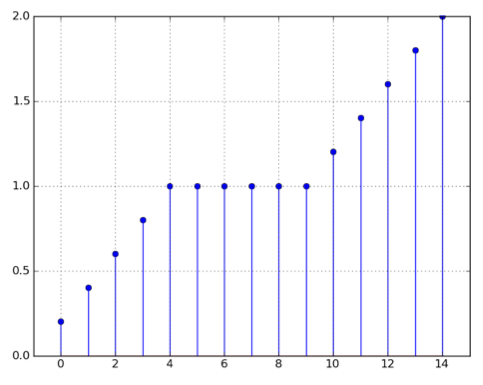
s[n] = Σk h[k] for k = 0, 1, ..., nAs n → ∞, we'll add up all the non-zero h[n] for each channel to get the value for s[∞]:
sI[∞] = 2
sII[∞] = 1
sIII[∞] = 2
sIV[∞] = 2.5
sV[∞] = 4.5
So the channels are I and III, which both have the final value of 2.
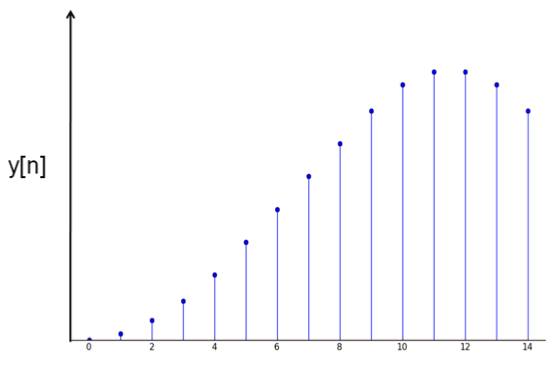
Explanation: since all five channels under consideration have unit sample responses h[n] satisfying the condition h[n] = 0 for n < 0, the channels are causal. Since x[n] equals u[n] (the unit step sequence) for n < 10, y[n] equals the unit step response of the channel for n < 10. Since the increments of the unit step response are the values of the unit sample response, and since the increments of x[n], as shown, are first increasing (until n = 5), and then not decreasing much (until n = 10), the unit sample response of the channel is increasing until n = 5 and then not decreasing much until n = 10, which leaves channel V as the only option.
For channel V, we have
y[15] = h[0]x[15] + h[1]x[14] + ... + h[15]x[0]
      = h[6] + h[7] + ... + h[15]
      = 0.5 + 0.5 + 0.5 + 0.5 + 0.4 + 0.3 + 0.2 + 0.1
      = 3