
Problem .
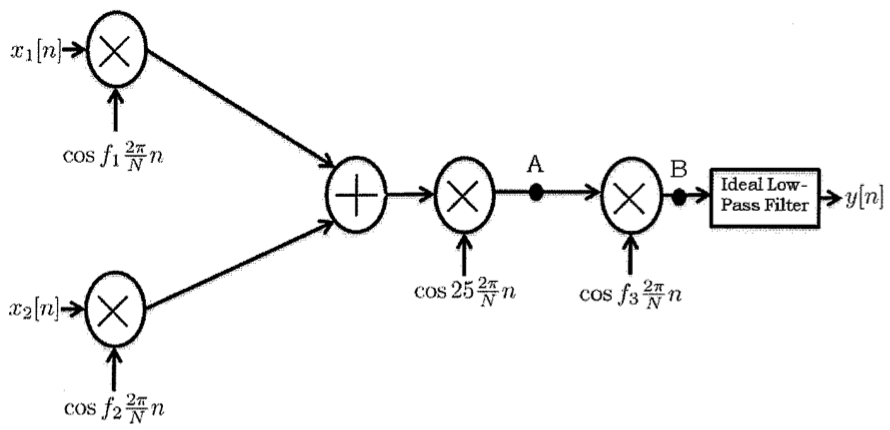
Here's our "standard" modulation-demodulation system diagram: at the transmitter, signal x[n] is modulated by signal mod[n] and the result (chan[n]) is sent to the receiver where the incoming signal is demodulated by demod[n] and sent through a low-pass filter to produce y[n].
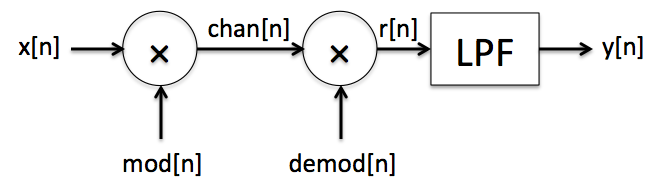
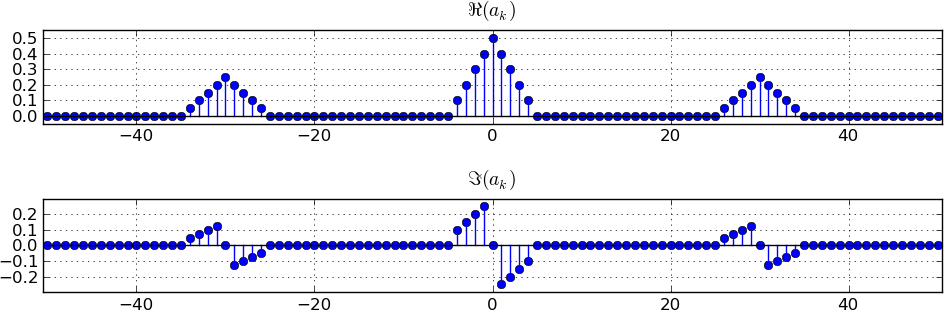
Suppose the band-limited signal x[n] has the spectral coefficients shown below, where N=101:
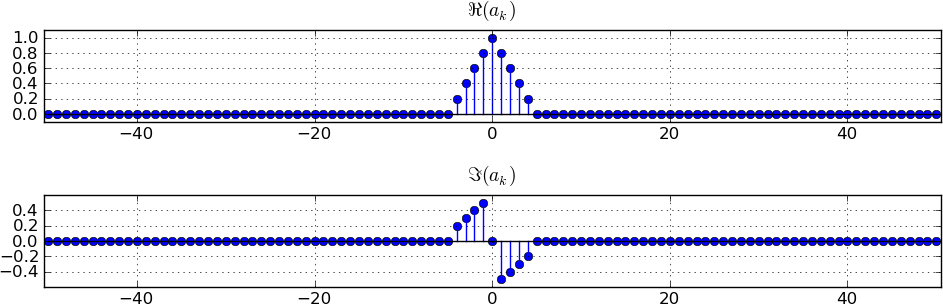
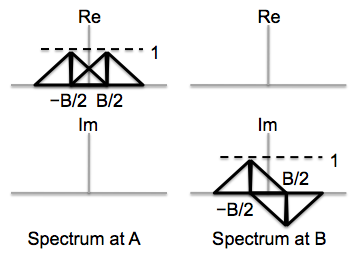
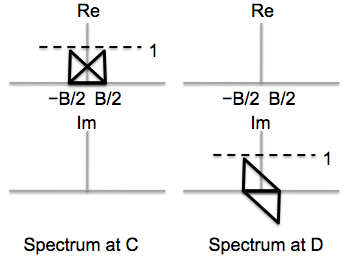
Let us say we want to modulate by a cosine with discrete frequency component f . To get the representation of this modulated signal in the frequency domain we move the spectrum of the original signal x[n] to the left and to the right symmetrically by -f and +f respectively. In the process we also scale down the spectrum of the original signal by one-half before moving to the left and to the right. Here f is 15, so we get two triangles at 0+15 and 0-15 respectively.
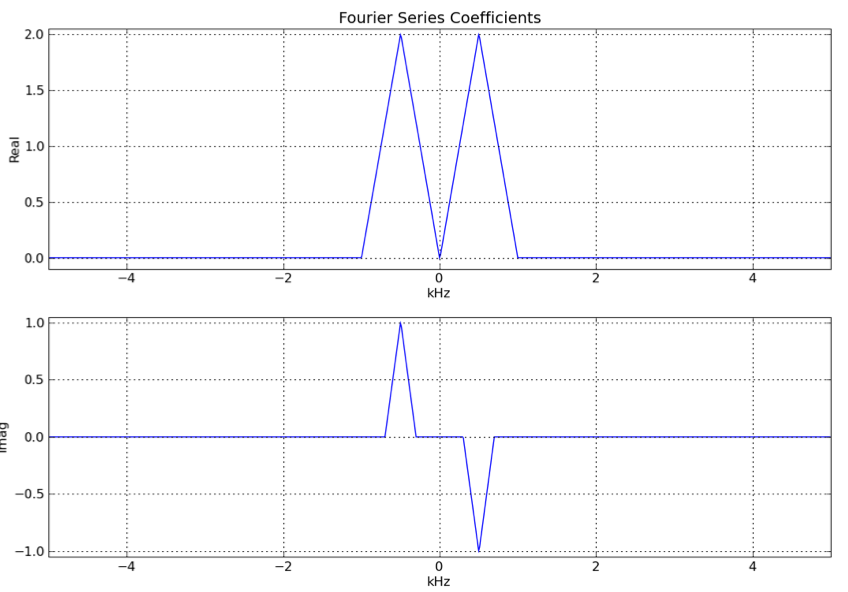
We can carry out the process independently for the real and imaginary components of the spectrum. In both cases we must remember to scale down by one-half. After carrying out these steps, we get the figures shown below.
Another alternative to this graphical process is to remember a dual of the convolution theorem. Recall from the Chapter on Frequency Response that convolution in the time domain is equivalent to multiplication in the frequency domain. A dual of this result holds as well, where multiplication in the time domain is equivalent to convolution in the frequency domain. Modulation, if you look at it closely, is just multiplication in the time domain. So the resulting frequency spectra of the modulated signal can be obtained by convolving the frequency spectra. The process of convolution is the same as we described for time domain sequencues, we simply flip-slide and dot away.
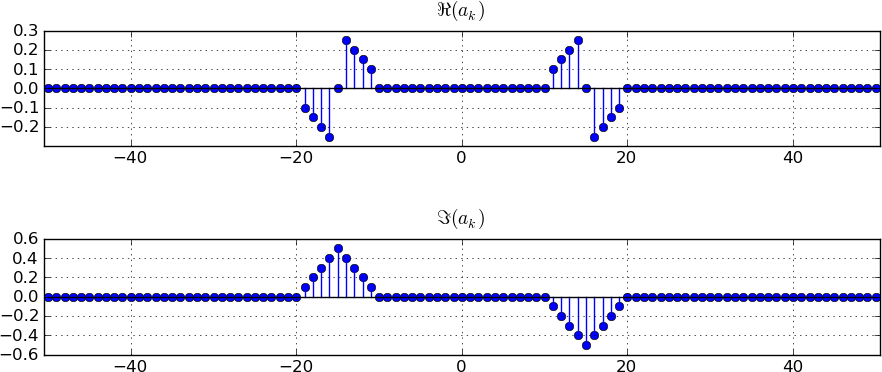
The procedure for modulating with a sine is similar to the procedure for modulating with a cosine. However, instead of scaling each portion by a factor of 0.5, we scale the portion moving to 0+f with -j/2 and the portion moving to 0-f with +j/2. This implies that the real part of the spectrum of x[n] now appears in the complex part of the spectrum of the modulated signal and vice versa. The figure below shows the resulting spectrum. Note how the real and imaginary parts have been interchanged.
Once again, if you prefer a more mathematical and less graphical approach, you can use convolution in the frequency domain as outlined earlier. If you are modulating by an sinusoid with arbitrary phase, you can break it up into a sine and a cosine and apply linearity to get the modulated signal spectrum.
Problem . Single-sideband (SSB) modulation is a modulation technique designed to minimize the amount of footprint used to transmit an amplitude modulated signal. Here's one way to implement an SSB transmitter.

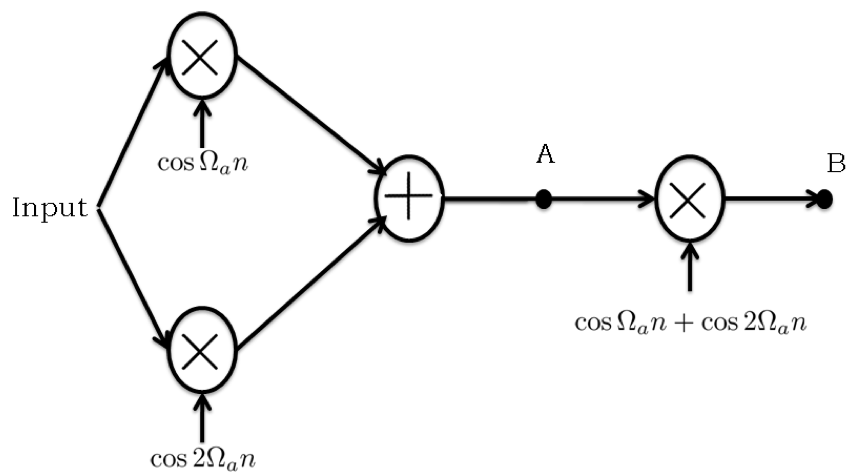
Consider the simple modulation-demodulation system below, where all signals are assumed periodic with period N = 10000 and the sampling frequency, fs, is 10000 samples per second. In addition, Ωa = 2π(fa/fs) = (1000*2π)/10000.
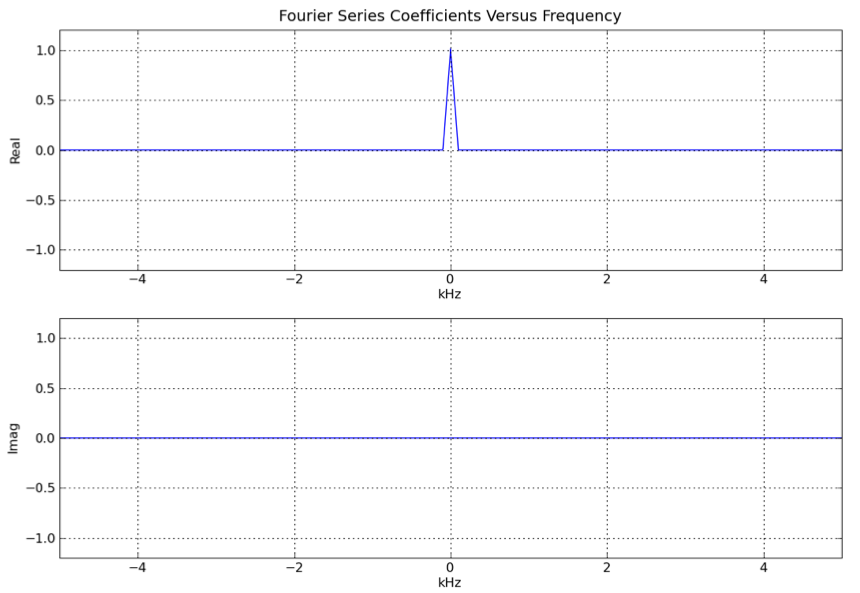
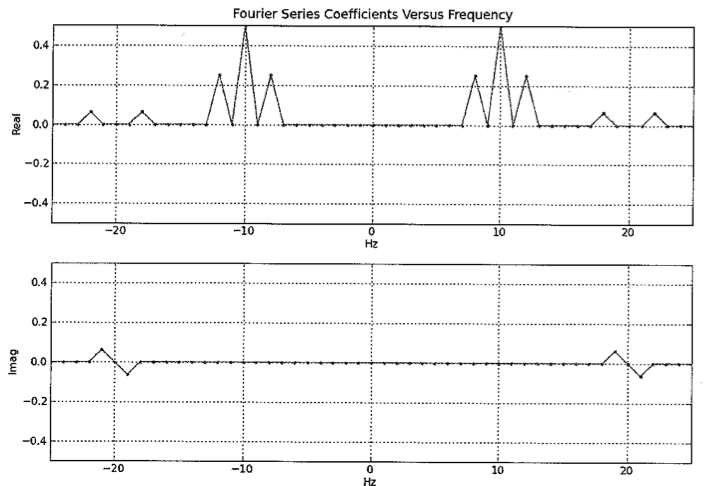
The Fourier Series coefficients versus frequency for the input to the modulation-demodulation system are plotted below for the case N=10000 and fs=10000. Note that the Fourier coefficients are nonzero only for -100 ≤ k ≤ 100.
Please plot the Fourier series coefficients versus frequency for the signals at location A and B in the above diagram. Be sure to label key features such as values and coefficient indices for peaks. Also indicate the width of the peaks.
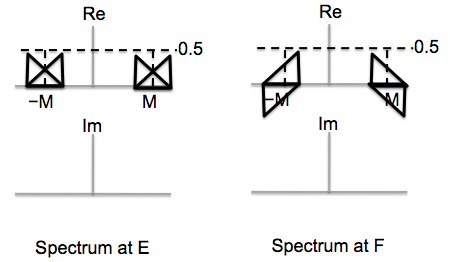
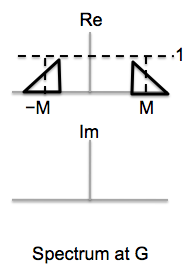
The signal is modulated by 2 carrier waves, a cosine at 1000 and a cosine at 2000. These two modulated spectra are then added up. The original signal spectrum is at the origin, so after modulation the spectral components appear at +/- 1000 and +/- 2000 respectively. The spectrum at A simply adds these two spectra and hence we get 4 peaks ie at +/- 1000 and +/- 2000. The height of the peak is one-half that of the original and the width remains the same as in the original signal ie 100Hz.

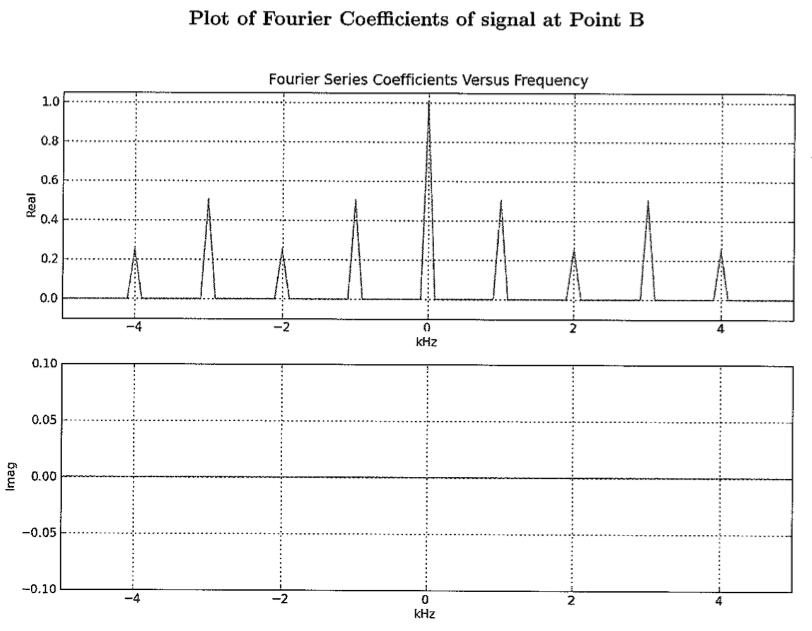
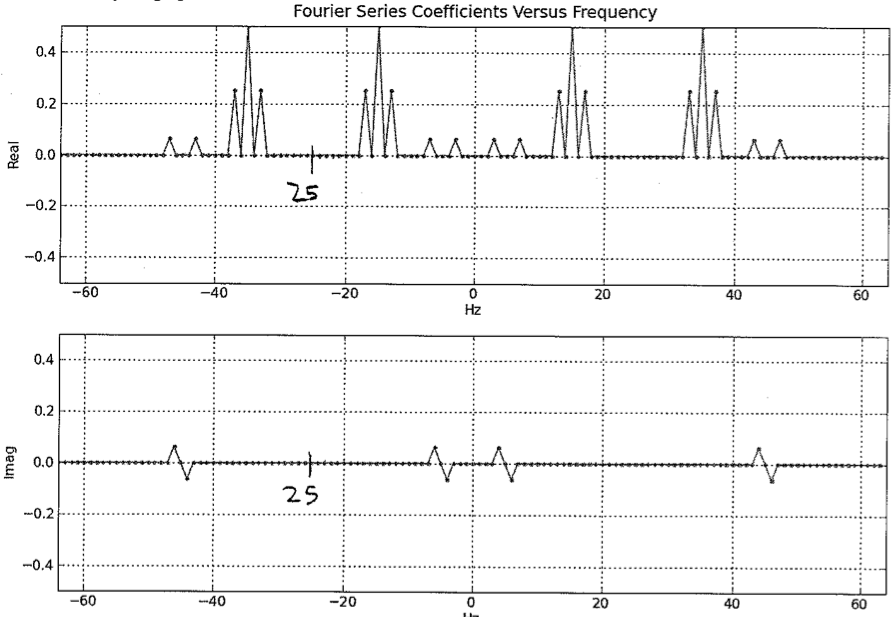
For the spectrum at B, each of the peaks in A's spectrum are shifted and scaled by each of the modulating components . There are 2 modulating components since we are multiplying by (cos Omega + cos 2 *Omega) . There are 4 peaks in A's original spectrum. So the resulting peaks are at frequencies
2000 + 2000 = 4000
2000 - 2000 = 0
1000 + 2000 = 3000
1000 - 2000 = -1000
2000 + 1000 = 3000
2000 - 1000 = 1000
1000 + 1000 = 2000
1000 - 1000 = 0
-2000 + 2000 = 0
-2000 - 2000 = -4000
-1000 + 2000 = 1000
-1000 - 2000 = -3000
-2000 + 1000 = -1000
-2000 - 1000 = -3000
-1000 + 1000 = 0
-1000 - 1000 = -2000
Each of these is scaled down by 2 wrt the original peak height, so each of these 8 has a height of 1/4. There are 2 peaks at 3000 which add up to give back a height of 1/2. Similarly at -3000, -1000 and +1000. Hence, all these peaks have height 1/2. This accounts for 4*2 = 8 peaks. 4 peaks are located at 0, and all of these add up to give a peak of height 1 at frequency 0. This accounts for 4 more peaks. The remaining 4 (16-4*2 - 4) are all "singleton" peaks at +/- 4000 and +/- 2000 respectively with height 1/4.
In this modulation problem you will be examining periodic signals and their associated discrete-time Fourier series (DTFS) coefficients. Recall that a periodic signal x[n] with period N has DTFS coefficients given by
ak = (1/N)Σn=<N>x[n]e-jk(2π/N)n
and that the signal x[n] can be reconstructed from the DTFS coefficients using
x[n] = Σk=<N>akejk(2π/N)n
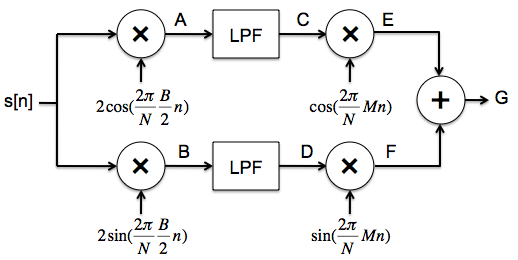
All parts of this question pertain to the following modulation-demodulation system, where all signals are periodic with period N = 10000. Please also assume that the sample rate associated with this system is 10000 samples per second, so that k is both a coefficient index and a frequency. In the diagram, the modulation frequency, km, is 500.
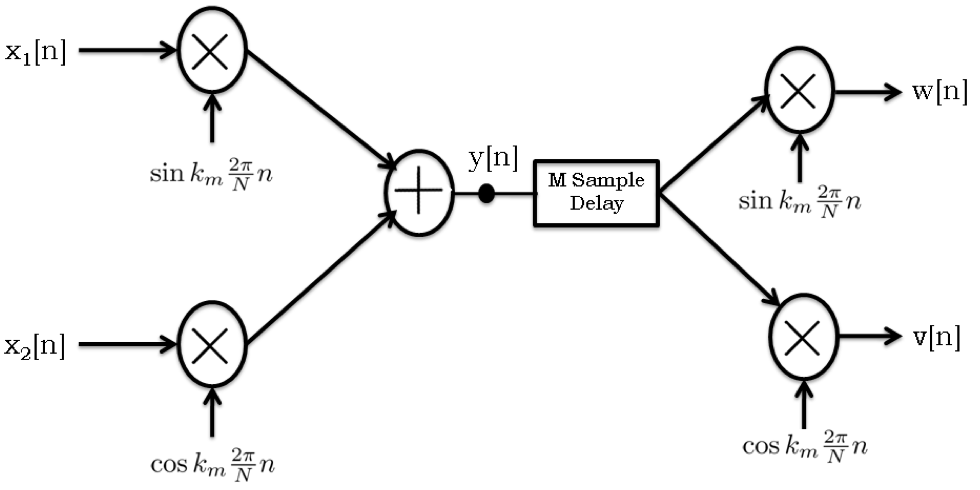
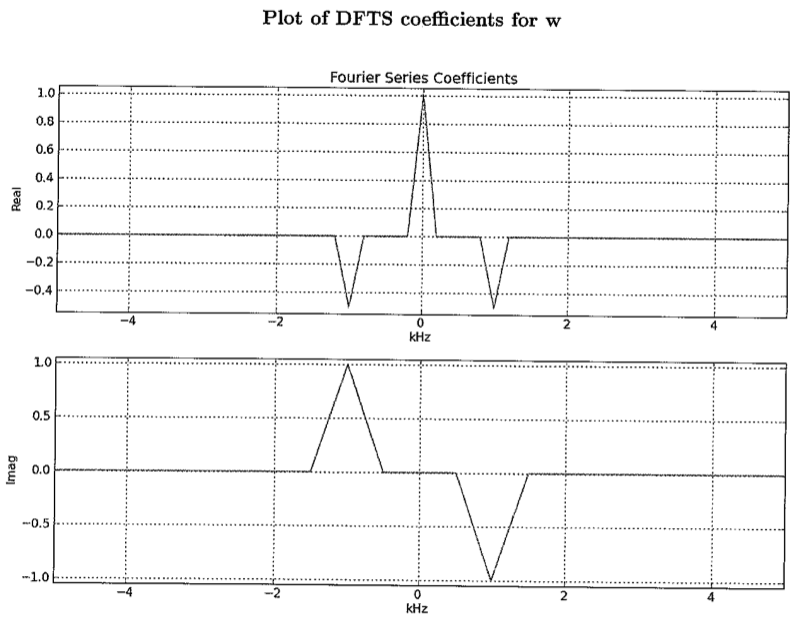
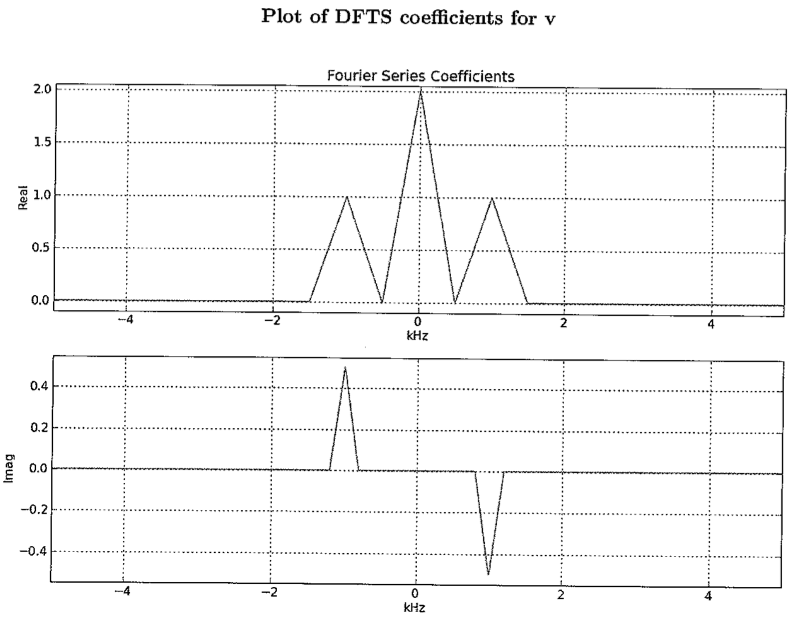
Assuming that M = 0 for the M-sample delay (no delay), please plot the DTFS coefficients for the signals w and v in the modulation/demodulation diagram. Be sure to label key features such as values and coefficient indices for peaks.
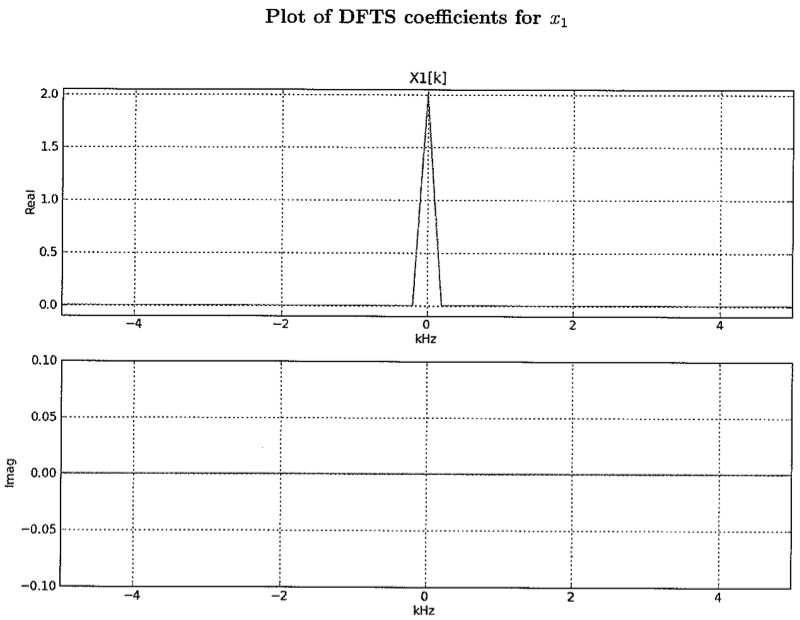
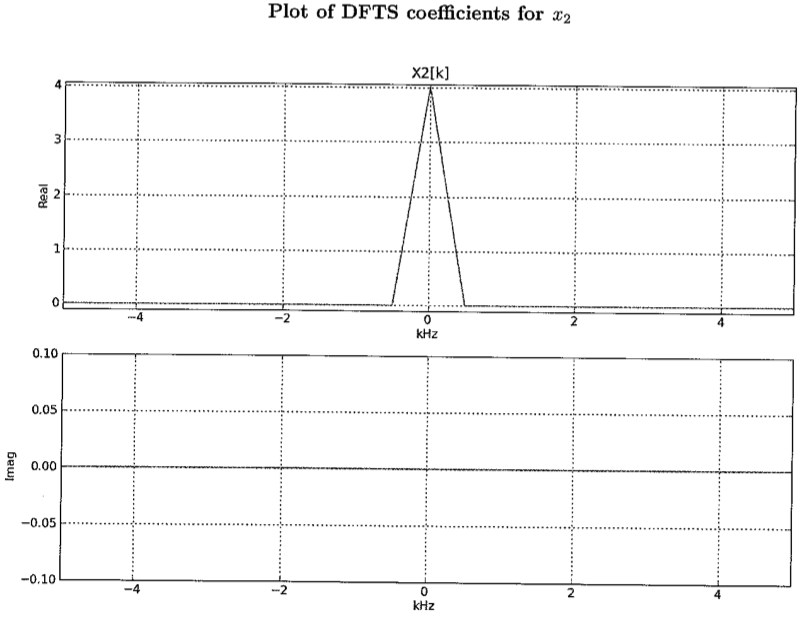
For the record, above are the coefficients for x2[n]:
sin(km(2π/N)(n-M)) ≈ cos(km(2π/N)n)
i.e., M samples of delay should introduce a phase shift of +π/2, or, equivalently, -3π/2:
-3π/2 = 500(2π/10000)(-M) = (-M)π/10So if M = 15 we get the desired result. Looking at the imaginary part of the plot in part (A), which shows x1[n] modulated by sin(...), we see that the bandwidth of x is 250 kHz.
Note that if M=5, the phase shift is -π/2, which produces -cos(...), which we can convert to cos(...) if the LPF has a gain of -1.
In answering this question, please refer to the modulation-demodulation system diagrammed below. Assume that N=128 and that the sampling frequency, fs, is 128 samples per second.
x1[n] = α + βcos(2(2π/N)n) and
x2[n] = (1/2)cos(2(2π/N)n) + (1/2)sin((2π/N)n)
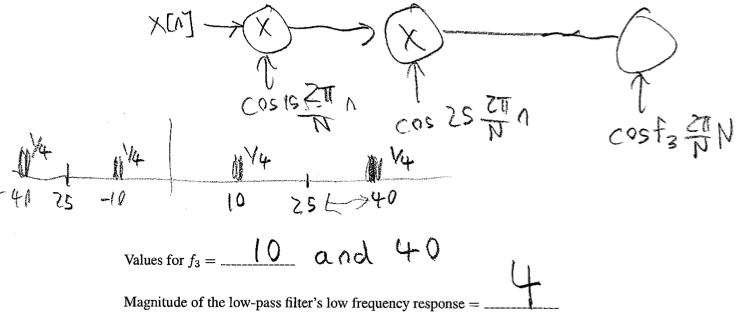
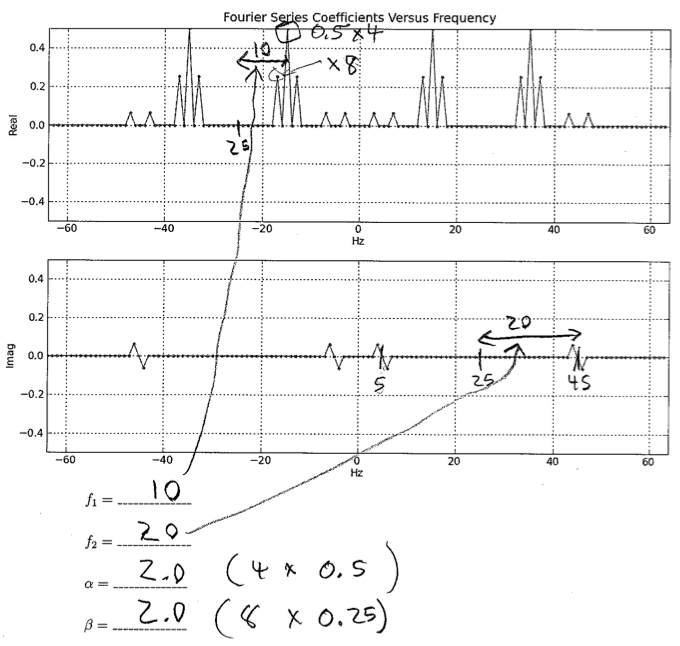
please determine the two modulation frequencies, f1 and f2, and the two amplitudes, α and β.
x1[n] = (1/2)cos(2(2π/N)n) + (1/2)sin((2π/N)n)
x2[n] = 0
and f1 = 15 (not one of the answers to part B!). For what values of f3 < 64 (there is more than one) will y[n] = x1[n], assuming that the low-pass filter has been designed correctly? In addition, what should the magnitude be for the low frequency response of the low-pass filter?