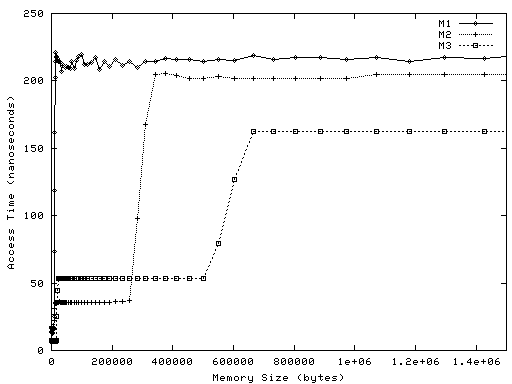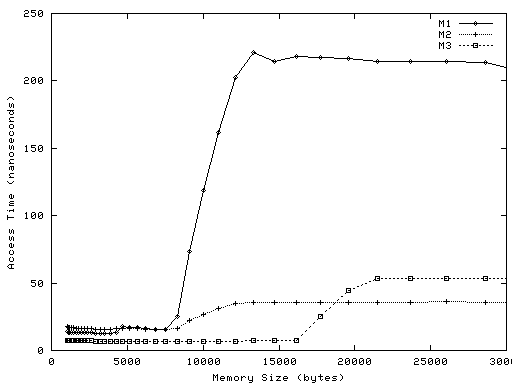
Below are two graphs of the resulting data. Each point on each graph represents one run of latency. The X value is the amount of memory allocated by the program, in bytes. The Y value is the average amount of time it took a load to complete, in nanoseconds.
Graph 1 plots all the data
for all three machines:

Graph 2 zooms in on
memory sizes from 1024 to 30,000 bytes:

You can see the raw data files for the three machines at these links: M1, M2, and M3.
As an example, the plot for M1 has a point at X=21,504 and Y=215. This means that when latency looped over an array of 21,504 bytes, the completion time for loads from the array averaged 215 nanoseconds.
The maximum memory size involved, 1.5 megabytes, is much smaller than the machines' main memories. That is, none of the data involve paging or swapping.
Here is the a simplified version of latency's algorithm:
char *array = malloc(size);
while(...)
  for(i = 0; i < size; i = i + 32)
    junk = array[i];
print the total running time divided by the number of loads from array[].
The reason for loading every 32nd byte, rather than every byte, is that the CPU cache line size for the three machines is 32 bytes. That is, when a load from location L results in the CPU loading data into a cache, the CPU also loads the 32-byte-aligned block of bytes around L. latency uses a stride of 32 bytes so that each load will touch a different cache block.
athena% add gnu
athena% gcc -O -o latency latency.c
Run latency like this:
athena% ./latency 1024 1572864 32 > latency.out
The first argument is the minimum amount of memory (in bytes) to test; the second is the maximum; the third should be 32 unless you have a better guess at your machine's cache block size. You may need to use a larger maximum value on some machines; your maximum is probably large enough when raising it doesn't increase the access times reported by latency. We've tested latency on SPARC and x86 CPUs; it may not work well on other machines.
You'll want to use a graphing program such as gnuplot to view the results. For example,
athena% add gnu
athena% gnuplot
gnuplot> set data style linespoints
gnuplot> plot "latency.out"
To zoom in on just small memory sizes:
gnuplot> plot [0:64000] "latency.out"
You can direct gnuplot's output to a laser printer thus:
gnuplot> set term postscript monochrome
gnuplot> set output "| lpr"
gnuplot> plot ...
gnuplot> set output
gnuplot> set term x11
1. How many levels of memory hierarchy can you spot from the graphs?
2. Roughly how big is each level? You only need to answer for the levels for which you have enough data.
3. Roughly how fast is each level?
4. Is each of the Mx CPU generations entirely better than the previous?
5. What design tradeoffs seem to have occured in the evolution from M2 to M3?
6. What is the approximate ratio of the access times on M1 and M3 for a memory size of 1.5 megabytes? For 1024 bytes? How do these ratios relate to the trends in the graph in the Lecture 2 notes titled "Figure 6: Trends in DRAM and processor cycle times"?
7. How much time did you spend on this assignment?