This assignment will help you understand some important concepts in time-sharing. It is based on this simple C program that runs the following loop n times, where n is an input parameter:
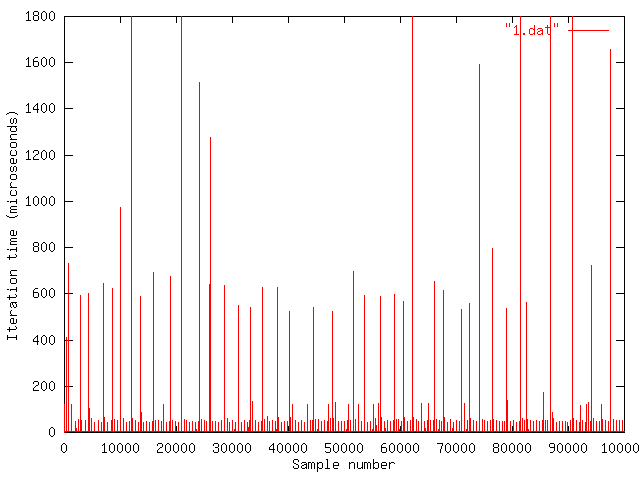
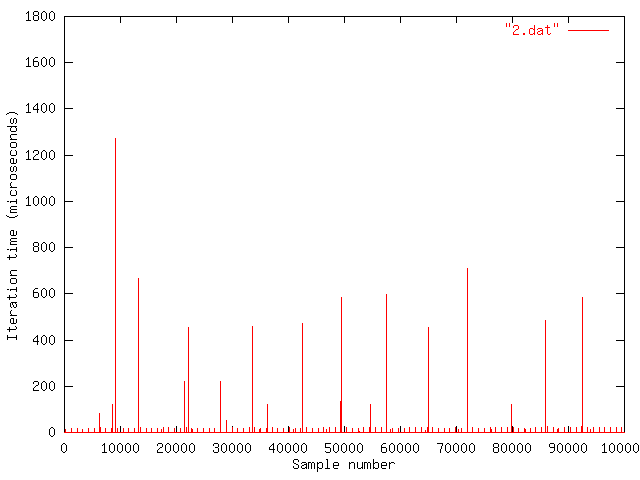
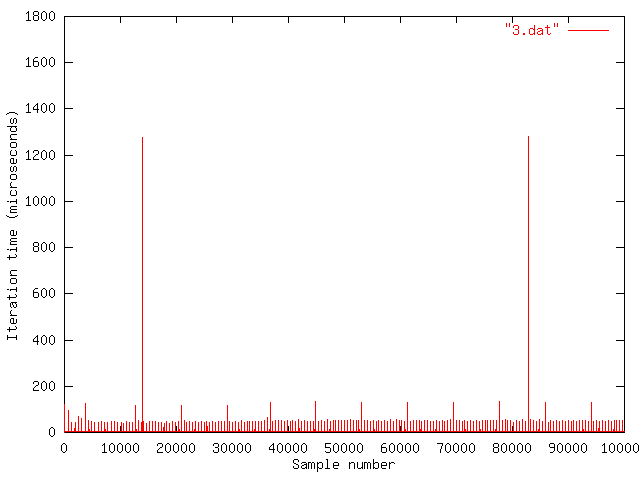
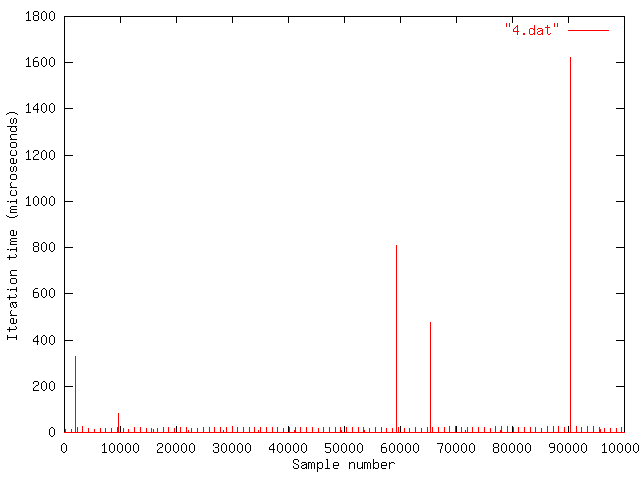
We ran this program four times on a time-shared computer.
The loading was done by concurrently running a disk-intensive program (the UNIX "find" utility on a local file system, if you really want to know.) We then plotted the four graphs shown below. The graphs are not necessarily in the same order as the above-mentioned order of experiments.
Note: An earlier version of ts would crash with an error like "Segmentation Fault" under certain circumstances. There is now a new version of the program which should hopefully fix this problem. If you were having problems, please try this section again with the new version of the program.You can find a copy of the source for ts at this link. Compile it with gcc:
athena% add gnu
athena% gcc -o ts ts.c
Run ts like this:
athena% ./ts [-p] number_of_iterations
Try running ps a few times on your own computer and see which results you will get. To save the results, pipe the output to a file, for example:
athena% ./ts [-p] number_of_iterations > ts-data
You'll want to use a graphing program such as gnuplot to view the results. For example,
athena% add gnu
athena% gnuplot
gnuplot> set xlabel "Sample number"
gnuplot> set ylabel "Iteration time (microseconds)"
gnuplot> set data style impulse
gnuplot> plot "ts-data" with lines
To set the range to make the graph more visible:
gnuplot> set yrange [0:1800]
gnuplot> plot "ts-data" with lines
You can direct gnuplot's output to a laser printer thus:
gnuplot> set term postscript monochrome
gnuplot> set output "| lpr"
gnuplot> plot ...
gnuplot> set output
gnuplot> set term x11
athena% (./ts 100000 >data1 & ; ./ts 100000 >data2 &)
Plot data1 and data2 and explain what you are seeing.