Statistics Collection Methodology
We supply you with a program called latency that allocates a specified amount of memory, loops repeatedly over the memory loading every 32nd byte into the CPU, and finally prints out how long the average load took to complete. latency runs this test for a range of total sizes and prints, for each size, the average time to load for that size.Here is the a simplified version of latency's algorithm:
char *array = malloc(size);
while(...)
  for(i = 0; i < size; i = i + 32)
    junk = array[i];
print the total running time divided by the number of loads from array[].
The reason for loading every 32nd byte, rather than every byte, is that the CPU cache line size for most machines is 32 bytes. That is, when a load from location L results in the CPU loading data into a cache, the CPU also loads the 32-byte-aligned block of bytes around L. latency uses a stride of 32 bytes so that each load will touch a different cache block.
How To Run latency
You can find a copy of the source for latency at this link. Compile it with gcc:athena% add gnu athena% gcc -O -o latency latency.cRun latency like this:
athena% ./latency 1024 1572864 32 > latency.out
The first argument is the minimum amount of memory (in bytes) to test; the second is the maximum; the third should be 32 unless you have a better guess at your machine's cache block size. You may need to use a larger maximum value on some machines; your maximum is probably large enough when quadrupling it doesn't increase the access times reported by latency. However, don't use maximum values that are anywhere near the total amount of memory on your machine, since that will cause paging; if in doubt, don't exceed 8 million. We've tested latency on SPARC and x86 CPUs; it may not work well on other machines.
You'll want to use a graphing program such as gnuplot to view the results. For example,
athena% add gnu
athena% gnuplot
gnuplot> set data style linespoints
gnuplot> set xlabel "Memory Size (bytes)"
gnuplot> set ylabel "Access Time (nanoseconds)"
gnuplot> plot "latency.out"
To zoom in on just small memory sizes:
gnuplot> plot [0:64000] "latency.out"
You can direct gnuplot's output to a laser printer thus:
gnuplot> set term postscript monochrome
gnuplot> set output "| lpr"
gnuplot> set xlabel "Memory Size (bytes)"
gnuplot> set ylabel "Access Time (nanoseconds)"
gnuplot> plot ...
gnuplot> set output
gnuplot> set term x11
Sample Statistics
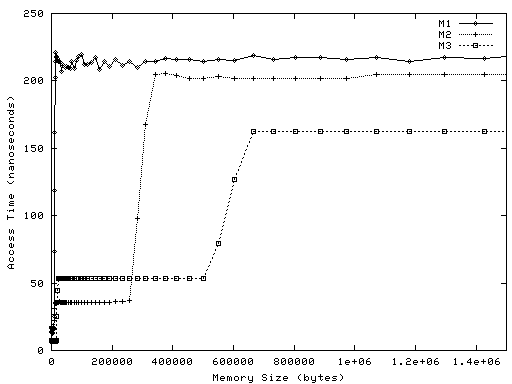
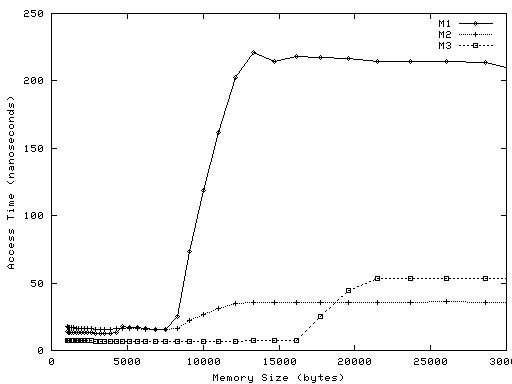
To help you understand what you're looking for, here is sample latency output from three real machines, called M1, M2, and M3. The three machines use different microprocessors; they are of three successive generations from the same manufacturer.Below are two graphs of the resulting data. Each point on each graph represents one run of latency. The X value is the amount of memory allocated by the program, in bytes. The Y value is the average amount of time it took a load to complete, in nanoseconds.
Graph 1 plots all the data
for all three machines:

Graph 2 zooms in on
memory sizes from 1024 to 30,000 bytes:

As an example, the plot for M1 has a point at X=21,504 and Y=215. This means that when latency looped over an array of 21,504 bytes, the completion time for loads from the array averaged 215 nanoseconds.
Collecting Your Own Data
Find two UNIX or Linux or SunOS/Solaris machines with different architectures, or at least different generations of CPU. If you're in doubt, make sure the strings printed by uname -i are different. If that doesn't work, use uname -m. Choose unloaded or very lightly loaded machines; ordinary Athena workstations are fine, but dial-up Athena machines are not. You can use the uptime command to see if a machine is loaded; if the last three numbers are all less than about 0.02, the machine is lightly loaded. latency will produce nonsense if the machine is loaded.Run latency on these two different machines, print the resulting graphs, and answer the following questions.
Questions to answer
1. For each of the two machines, how many levels of memory hierarchy can you spot from the graphs?
2. What is the approximate size (in bytes) of each level?
3. Roughly how long does it take to load memory from each level, in nanoseconds?
4. Which one of your two machines seems to have the better memory system -- or is there no clear winner?
5. How much time did you spend on this assignment?