M.I.T. DEPARTMENT OF EECS
| 6.033 - Computer System Engineering | TCP Hands-On Assignment |
Complete the following hands-on assignment. As usual, submit your solutions using the online submission site by 11:59p.
We recommend, but do not require, that you perform this assignment on
Athena. Please note that the TAs cannot guarantee tech support if you
do not use an Athena workstation. Before you begin the assignment,
please verify the following:
athena% add ops
sudo apt-get install tcpdumpssh -X athena.dialup.mit.eduIn this assignment you will understand how TCP works using tcpdump. To begin with, download the tcpdump log file from here. You can also download it on any linux machine using:
athena% wget http://web.mit.edu/6.033/www/assignments/tcpdump.dat
For this assignment, we used a program that transmits a file from a machine called willow to a machine called maple over a TCP connection. We ran the tcpdump tool on the sender, willow, to log both the departing data packets and the received acknowledgments (ACKs).
The file tcpdump.dat is a binary file which contains a log of all the TCP packets for the above TCP connection. The file is not human-readable. To parse the file, you can use tcpdump. For more information on tcpdump, you can look at:
athena% man tcpdump
To understand the log file in a human-readable format, run:
athena% tcpdump -r tcpdump.dat > outfile.txt
Now open outfile.txt on your preferred text editor. The output has several lines listing packets sent from willow to maple, and the ACKs from maple to willow. For example:
00:34:41.474225 IP willow.csail.mit.edu.39675 > maple.csail.mit.edu.5001: Flags [.], seq 1473:2921, ack 1, win 115, options [nop,nop,TS val 282136474 ecr 282202089], length 1448
Denotes a packet sent from willow to maple. TCP uses sequence numbers to keep track of how much data it has sent. This packet has a sequence number 1473:2921, indicating that it contains all bytes from byte # 1473 to byte # 2920 (= 2921 - 1) in the stream, which is a total of 1448 bytes (note that 1448 = 2921 - 1473). The time stamp 00:34:41.474225 denotes the time at which the packet was transmitted by willow.
(Note: There may be very minor variations in the format of the output of tcpdump depending on the version of tcpdump on your machine.)
Once maple receives the packet, assuming that it has received all previous packets as well, it sends an acknowledgment (ACK):
00:34:41.482047 IP maple.csail.mit.edu.5001 > willow.csail.mit.edu.39675: Flags [.], ack 2921, win 159, options [nop,nop,TS val 282202095 ecr 282136474], length 0
This indicates that maple has received all bytes from byte # 0 to byte # 2920. The next byte # that maple expects is byte # 2921. The time stamp 00:34:41.482047, denotes the time at which the ACK was received by willow.
Question 1: What are the IP addresses of maple and willow on this network? (Hint: Check the man page of tcpdump to discover how you can obtain the IP addresses)
Question 2: How many kilobytes were transferred during this TCP session, and how long did it last? Based on these, what is the throughput (in KiloBytes/sec) of this TCP flow between willow and maple?
Question 3: What is the round-trip time (RTT) in seconds, between willow and maple, based on packet 1473:2921 and its acknowledgment? Look at outfile.txt and find the round-trip time of packet 13057:14505. Why are the two values different?
athena% wget http://web.mit.edu/6.033/www/assignments/tsg.xpl
To plot a time sequence graph of the tcpdump data you need xplot. To make it available on Athena machines, run the following command:
athena% add sipbnet
(Note: In case you prefer to use your own linux machine, xplot is available at for download at www.xplot.org. Please do not install the package "xplot" on Ubuntu machines. The correct version of xplot is in the Ubuntu repository as "xplot.org", and can be installed with "apt-get install xplot.org". To display the plot in this case, run "xplot.org tsg.xpl". Please note that the TAs cannot guarantee tech support if you do not use an Athena machine.)
Now you should be able to obtain the plot using:
athena% xplot tsg.xpl
(Note: In case you get the following error message: "fatal error: could not open display", you have probably not enabled X11 forwarding for ssh. Please check the X11 forwarding section above)
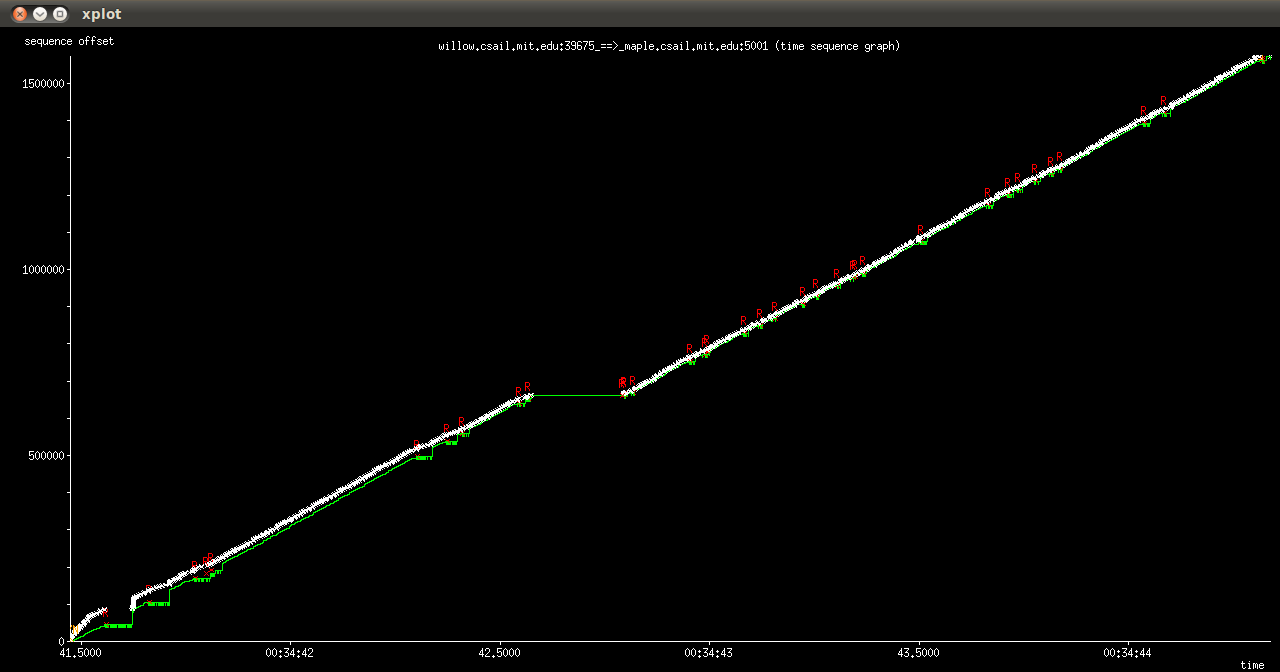
At this point, You should obtain a graph similar to the one in the figure below. Xplot allows you to zoom in / zoom out onto different portions of the figure:
The graph shows the number of bytes transmitted so far as a function of the time (in seconds). The time is taken from the tcpdump timestamp. The plotting program expresses the full time, in hh:mm:ss every second, and shows only the seconds in-between.
The graph depicts different quantities:
Question 4: You may notice that the white arrows occur always close to a "transition" in the green line. Do they occur to the left (i.e. before) or to the right of (i.e. after) these transitions? Why do you think this is the case?
When a packet is lost, the transmitter does not receive an acknowledgment for it. You may recall that the lecture on TCP described two mechanisms by which a sender identifies a packet loss: three duplicate ACKs, or timeout. Answer the following questions on packet loss by zooming-in on the xplot graph.
Question 5: Find the lowest sequence number of a packet which was re-transmitted after 3 duplicate ACKs. You are permitted to round the sequence number to the nearest 1000 (e.g. you can say 13000:15000 instead of 13057:14505).
Question 6: Find the lowest sequence number of a packet which was re-transmitted after a time-out. You are permitted to round the sequence number to the nearest 1000.
Question 7: What aspect of TCP's behavior causes these white arrows to lie approximately on a line?
Question 8: Can you provide an equation that relates the slope of the above line to the average congestion window size (in Bytes) and the average round-trip time (RTT) of the TCP connection?
A sender and receiver are connected by multiple links in the network. Each link may have a different capacity. The maximum capacity of the path between the sender and receiver is dictated by the link with least capacity (i.e. the bottleneck link).
Packet pair is a technique for estimating the bottleneck capacity of a path. The packet-pair technique transmits two packets back-to-back from the transmitter to the receiver. These packets traverse a series of links connecting the source to destination. Note that for any such link with a link capacity is C Bytes/s, the span of a packet of length B bytes on the link equals B/C seconds. For example, in the figure below, tb, is the span of the packet on the bottleneck link.
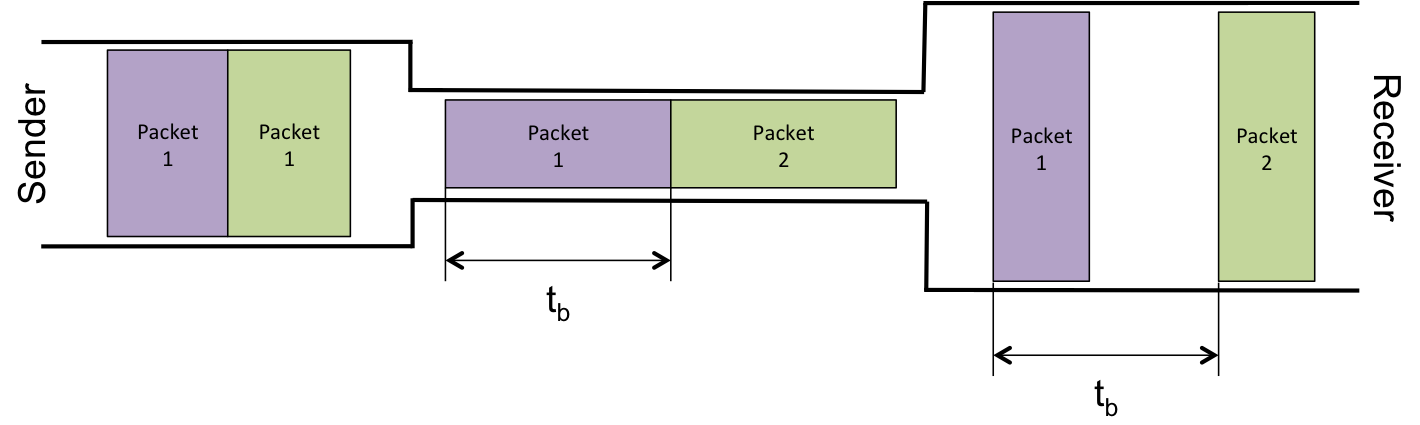
Note that when you send two packets back-to-back, the inter-packet spacing will be defined by the bottleneck link, as shown in the figure. Hence, measuring the inter-arrival time (i.e. the time between the beginning of the two packets) at the receiver, provides a good estimate of the capacity of the bottleneck link. Note that though the bottleneck link will be followed by a link with higher capacity, this new link preserves the bottleneck spacing between the two packets. (Think why this is the case!)
Question 9 (Optional): For the path between willow and maple, the median inter-arrival time for a packet pair was estimated to be 0.0013 seconds. Each packet in the packet pair contained 1500 Bytes. What is the bottleneck capacity of the path (in KiloBytes/sec) between willow and maple, based on this inter-arrival time?
Question 10 (Optional): Give a potential reason why the throughput of the TCP connection, estimated in Question 2, is different from the capacity of the bottleneck link.