You may collaborate and discuss ideas with others in the class, but your solutions and presentation must be your own. Do not look at anyone else's solutions or copy them from anywhere. Please list your collaborators on your submission.
Commit your solutions and submit to Canvas before NOON on Monday, October 4, 2021.
Download the handout here.
![]()
The handout is a virtual machine in .ova format, which should include everything you need for the lab and a clone of the starter repo. You may open the VM using VMWare, available for free to all MIT students. Both the username and the password are mininet.
The deliverables include two parts: code, and answers to questions. You will upload a PDF file to Canvas, which includes answers to all questions and a pointer to your code (details below).
For code, you should create a private github.mit.edu repository based on the starter repository (already cloned to the home directory on the VM), and add usernames "frankc" and "leiy" as collaborators to your repository. Then, at the beginning of your PDF file, put the link to the repository and the hash of the last commit of the repository.
For answers, please be as clear and concise as possible.
If you would like to use an extension day, please contact the staff individually.
The "Introduction to Mininet" tutorial on github has a number of examples to help you with common tasks you will encounter in this assignment: creating topologies, spawning programs (ping, iperf, etc.) and collecting output.
Viewing plots. The VM does not have a desktop environment. To look at your output, you may either copy the plots from the VM to your laptop using scp, or you may start a web server using python -m http.server inside the lab directory. Then, you can point a web browser to vm-ip-address:8000 and browse the files. (You may want to make sure that port 8000 of the VM is accessible from your laptop. It should be if you used the default setting when importing the VM.)
Cleaning up Mininet. If your Mininet script does not exit cleanly due to an error (or if you pressed Control-C), you may want to issue a clean command sudo mn -c before you start Mininet again.
This problem is an extended version of a problem from Stanford's Winter 2013 CS244 course (used with permission).
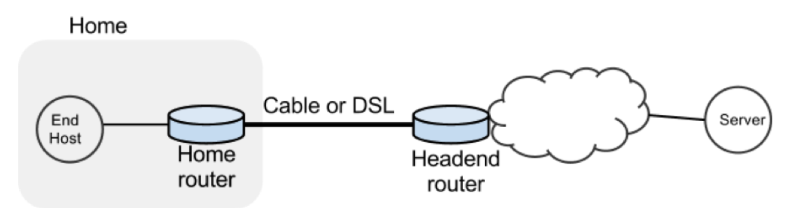
In this exercise, we will study the dynamics of TCP in home networks. Take a look at the figure below which shows a "typical" home network with a Home Router connected to an end host. The Home Router is connected via Cable or DSL to a Headend router at the Internet access provider's office. We are going to study what happens when we download data from a remote server to the End Host in this home network.
In a real network, it's hard to measure cwnd (because it's private to the server) and the buffer occupancy (because it's private to the router). To ease our measurement, we are going to emulate the network in Mininet.
Within Mininet, create the following topology: h1 (repesenting your home computer) has a fast connection (1 Gbit/s) to your home router with a slow uplink connection (10 Mbit/s) to h2 (representing a web server). The round-trip propagation delay, or the minimum RTT between h1 and h2 is 20 ms. The router buffer size can hold 100 full sized ethernet frames (about 150 kB with an MTU of 1500 bytes).
Then do the following:
The starter code has some hints on how to do these steps. You will mostly modify bufferbloat.py, which should set up the topology and collect data, and run.sh, which runs bufferbloat.py with different parameters and plots the results. Look for TODOs in these files.
| File | Purpose |
|---|---|
| bufferbloat.py | Creates the topology, measures cwnd, queue sizes and RTTs and spawns a webserver. |
| plot_queue.py | Plots the queue occupancy at the bottleneck router. |
| plot_ping.py | Parses and plots the RTT reported by ping. |
| plot_tcpprobe.py | Plots the cwnd time-series for a flow specified by its destination port. |
| run.sh | Runs the experiment and generates all graphs in one go. |
Remember to keep answers brief.
Problem 2: TCP throughput & fairness
In this exercise we will study TCP's throughput and fairness characteristics with Mininet. Consider the topology shown in the figure below.
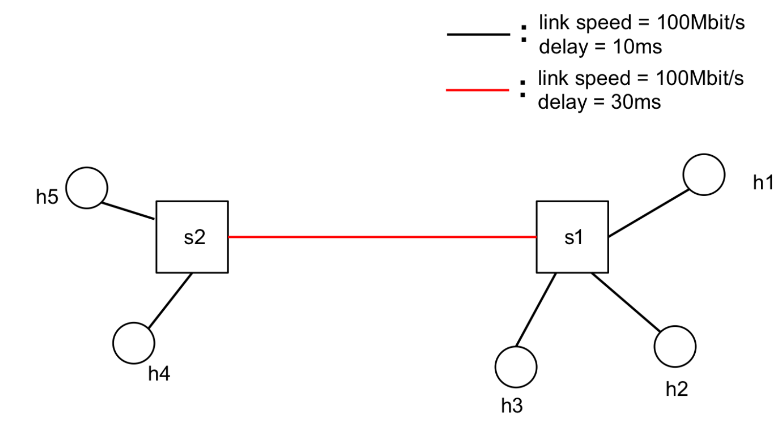
All links are 100 Mbit/s and have a one-way propagation delay of 10 ms, except for the link between S1 and S2, which has a 30 ms propagation delay. The switches have 1000 packets of buffer at each port, and use PIE active queue management with a target delay of 20 ms.
The goal of this exercise is to learn how the RTT and number of bottleneck links impacts throughput and fairness of TCP flows.
Within Mininet, create the topology shown above, and enable PIE with a target delay of 20 ms on the switch interfaces. Then do the following:
Scenario 1:
Scenario 2:
The starter code sets up the topology and configures PIE. You have to write code to generate the traffic (with iperf) and do the RTT measurements (with ping). Look for TODOs in the starter code.
| File | Purpose |
|---|---|
| tcpfairness.py | Creates the topology and sets up PIE. |
Remember to keep answers brief.
Answers should appear in the PDF submitted to Canvas. You should be able to answer the questions without writing any code.
Consider the same topology and TCP flows as in Scenario 2 of Problem 2. Recall that there are two bottleneck links in this scenario: S2->S1 and S1->h1. Assume that both links are 100% utilized and each has an average queueing delay of 20 ms. Assume also that the loss rates on these two links are small and independent.
Derive the throughput of the three flows: h5->h1, h4->h3, and h2->h1, using the equation relating TCP throughput to the loss rate and RTT.
Answers should appear in the PDF submitted to Canvas. You should be able to answer the questions without writing any code.
Louis Reasoner has been recruited by a hot new startup to design the packet queueing component of a high-speed router. The link speed of the router is 40 Gigabits/s, and he expects the average Internet round-trip time of connections through the router to be 100 ms. Louis remembers from his 6.829 days that he needs to put in some amount of buffering in the router to ensure high link utilization in the presence of the TCP sources in the network growing and shrinking their congestion windows. Louis hires you as a consultant to help design his router's buffers.
Assume for the purposes of these questions that you're dealing with exactly one TCP connection with RTT 100 ms (it turns out that this assumption does not change the results too much, for a drop-tail gateway, if the connections all end up getting synchronized). Also assume that the source is a long-running TCP connection implementing additive-increase (increase window size by 1/W on each acknowledgment, with every packet (TCP segment) being acknowledged by the receiver, such that the window increases by about 1 segment size every RTT) and multiplicative-decrease (factor-of-two window reduction on congestion). Assume that no TCP timeouts occur. Don't worry about the effects during slow start; this problem is about the effects on router buffering during TCP's AIMD congestion-avoidance phase.
You should (be able to) answer this question without running any simulations or writing code.
Problem 5: Cheating with XCP
Answers should appear in the PDF submitted to Canvas. You should be able to answer the questions without writing any code.
After reading the XCP paper in 6.829, Alyssa P. Hacker and Cy D. Fect get into an argument about just how fragile XCP is in the presence of senders who lie about the information they are given. Consider a version of XCP where the sender reports to the network its RTT and its throughput. In this protocol, the fields in the congestion header are: (i) RTT (ii) throughput (instead of cwnd), and (iii) feedback. (This change from the scheme in the XCP Sigcomm '02 paper will make it easier for you to reason about this problem.)
We will assume that the sender can lie about the RTT and throughput to the network in an attempt to persuade the network to give it more (or less, but that's not too interesting) than its correct share, or in an attempt to mess up the resulting link utilization (causing the network to run under-utilized or to be in persistent congestion). However, the sender does not send at an arbitrary rate; it always updates its congestion window according to the feedback the network sends. (This constraint on the sender is reasonable; after all, in XCP, a sender that simply wished to ignore the network's feedback could do so anyway, and such behavior would require other network-level mechanisms to detect and control.)
More precisely,
cwnd <-- cwnd + feedback true_RTT / declared_RTT.
This adjustment ensures that the increase in the sender's throughput is the one intended by the network.
Alyssa and Cy get into an argument about what happens when users misbehave and lie to the routers. Help them resolve their argument. Be precise and concise in your answers to these questions. These questions are intentionally somewhat under-specified, to encourage you to think about all the things that can go wrong.