Handle Graphics
Table of Contents, Get code for this tutorial
Note: You can execute the code from this tutorial by highlighting them, right-clicking, and selecting "Evaluate Selection" (or hit F9).
Handle Graphics is concept that MATLAB uses to deal with all MATLAB graphics. By understanding the concept of Handle Graphics, you will be able to customize just about anything graphics related.
Contents
Relevant Documentation
Getting a Handle to a Graphics Object
Almost all plotting functions return a handle to the graphics object. For example, if you call plot with an output argument,
x = rand(10, 1);
h = plot(x)
h =
  176.0028
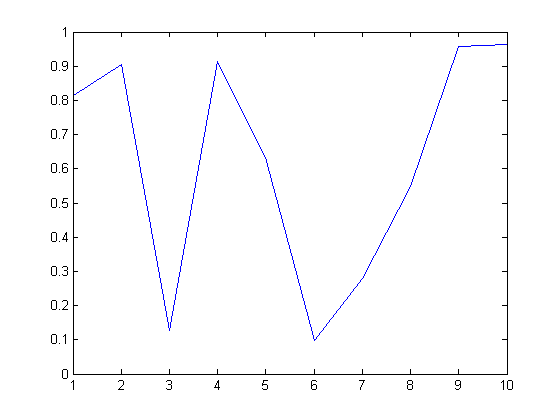
you get a "handle" to the line that was plotted. h may just look like a number (double precision), but internally MATLAB interprets it as a handle (or a pointer) to the line object.
Give it a Try
Try plotting multiple lines. How many handles do you get back?
h2 = plot(rand(10, 3))
Inspecting Graphics Properties (Interactively)
Now that you have a handle to the graphics object, what can you do with it? You can use the handle to access all the properties associated with the object. You can look at it and change it. To get a view of the current property settings, you can do it interactively.
inspect(h)
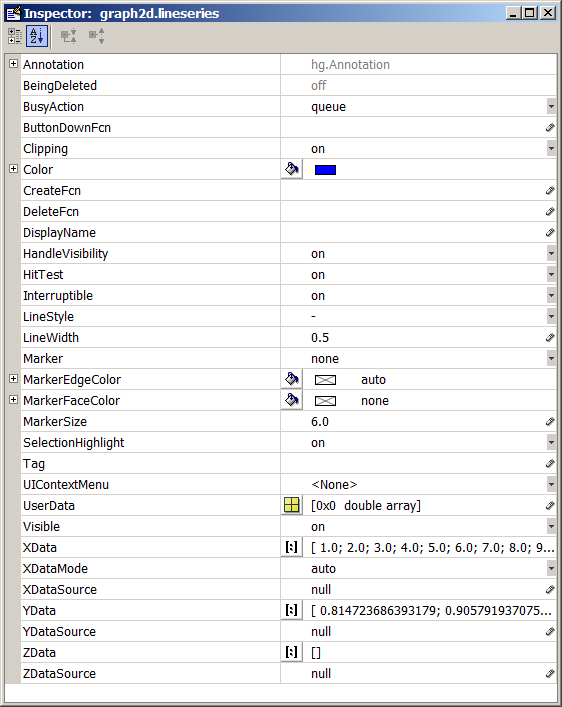
Changing the properties with the Property Inspector will reflect the change immediately.
Give it a Try
Try changing some of the properties and see the effect.
Accessing Graphics Properties (Programmatically)
You can also access graphics properties programmatically using the get and set commands.
get(h)
           DisplayName: ''
            Annotation: [1x1 hg.Annotation]
                 Color: [0 0 1]
             LineStyle: '-'
             LineWidth: 0.5000
                Marker: 'none'
            MarkerSize: 6
       MarkerEdgeColor: 'auto'
       MarkerFaceColor: 'none'
                 XData: [1 2 3 4 5 6 7 8 9 10]
                 YData: [1x10 double]
                 ZData: [1x0 double]
          BeingDeleted: 'off'
         ButtonDownFcn: []
              Children: [0x1 double]
              Clipping: 'on'
             CreateFcn: []
             DeleteFcn: []
            BusyAction: 'queue'
      HandleVisibility: 'on'
               HitTest: 'on'
         Interruptible: 'on'
              Selected: 'off'
    SelectionHighlight: 'on'
                   Tag: ''
                  Type: 'line'
         UIContextMenu: []
              UserData: []
               Visible: 'on'
                Parent: 175.0023
             XDataMode: 'auto'
           XDataSource: ''
           YDataSource: ''
           ZDataSource: ''
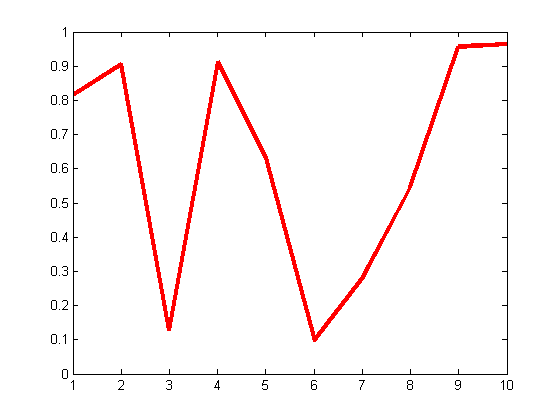
If you want to change the color of the line to read and the line thickness to 3
set(h, 'Color', 'red', 'LineWidth', 3)
Getting the Underlying Data
MATLAB plots contain the underlying data as well, so you can extract the data directly from their handles:
get(h, 'XData')
get(h, 'YData')
ans =
  Columns 1 through 9
     1     2     3     4     5     6     7     8     9
  Column 10
    10
ans =
  Columns 1 through 5
    0.8147    0.9058    0.1270    0.9134    0.6324
  Columns 6 through 10
    0.0975    0.2785    0.5469    0.9575    0.9649
Type of Graphics Object
In addition to knowing that each graphics object has a set of properties, it's important to know that there are different types of graphic objects. You can get that by the type property:
get(h, 'Type')
ans =
line
Handle Graphics Hierarchy
What are the different types of graphics objects and how are they related?
An important concept to understand is the Handle Graphics Hierarchy. Only certain types graphics objects can reside within a particular object. For example, a line object can be placed inside an axes object, but not inside a figure object. That means that, in order to plot a line, there must also be an axes. Conveniently, when you try to plot a line, MATLAB takes care of that by creating new axes if one does not exist.
This hierarchy is represented with a parent-children concept. An object can only have one parent, while a parent can have multiple children. For example, we can get the handle to the parent object for the line:
ph = get(h, 'Parent')
ph =
  175.0023
And we can see the properties of the parent object:
get(ph)
	ActivePositionProperty = outerposition
	ALim = [0 1]
	ALimMode = auto
	AmbientLightColor = [1 1 1]
	Box = on
	CameraPosition = [5.5 0.5 17.3205]
	CameraPositionMode = auto
	CameraTarget = [5.5 0.5 0]
	CameraTargetMode = auto
	CameraUpVector = [0 1 0]
	CameraUpVectorMode = auto
	CameraViewAngle = [6.60861]
	CameraViewAngleMode = auto
	CLim = [0 1]
	CLimMode = auto
	Color = [1 1 1]
	CurrentPoint = [ (2 by 3) double array]
	ColorOrder = [ (7 by 3) double array]
	DataAspectRatio = [9 1 2]
	DataAspectRatioMode = auto
	DrawMode = normal
	FontAngle = normal
	FontName = Helvetica
	FontSize = [10]
	FontUnits = points
	FontWeight = normal
	GridLineStyle = :
	Layer = bottom
	LineStyleOrder = -
	LineWidth = [0.5]
	MinorGridLineStyle = :
	NextPlot = replace
	OuterPosition = [0 0 1 1]
	PlotBoxAspectRatio = [1 1 1]
	PlotBoxAspectRatioMode = auto
	Projection = orthographic
	Position = [0.13 0.11 0.775 0.815]
	TickLength = [0.01 0.025]
	TickDir = in
	TickDirMode = auto
	TightInset = [0.0392857 0.0404762 0.0142857 0.0190476]
	Title = [180.002]
	Units = normalized
	View = [0 90]
	XColor = [0 0 0]
	XDir = normal
	XGrid = off
	XLabel = [177.002]
	XAxisLocation = bottom
	XLim = [1 10]
	XLimMode = auto
	XMinorGrid = off
	XMinorTick = off
	XScale = linear
	XTick = [ (1 by 10) double array]
	XTickLabel =
		1
		2
		3
		4
		5
		6
		7
		8
		9
		10
	XTickLabelMode = auto
	XTickMode = auto
	YColor = [0 0 0]
	YDir = normal
	YGrid = off
	YLabel = [178.002]
	YAxisLocation = left
	YLim = [0 1]
	YLimMode = auto
	YMinorGrid = off
	YMinorTick = off
	YScale = linear
	YTick = [ (1 by 11) double array]
	YTickLabel = [ (11 by 3) char array]
	YTickLabelMode = auto
	YTickMode = auto
	ZColor = [0 0 0]
	ZDir = normal
	ZGrid = off
	ZLabel = [179.002]
	ZLim = [-1 1]
	ZLimMode = auto
	ZMinorGrid = off
	ZMinorTick = off
	ZScale = linear
	ZTick = [-1 0 1]
	ZTickLabel =
	ZTickLabelMode = auto
	ZTickMode = auto

	BeingDeleted = off
	ButtonDownFcn =
	Children = [176.003]
	Clipping = on
	CreateFcn =
	DeleteFcn =
	BusyAction = queue
	HandleVisibility = on
	HitTest = on
	Interruptible = on
	Parent = [174.002]
	Selected = off
	SelectionHighlight = on
	Tag =
	Type = axes
	UIContextMenu = []
	UserData = []
	Visible = on
With this technique, you can pretty much access any graphics objects by traversing up and down the hierarchy.
Finding Handles
What if I don't have a handle to work with? For example, if I happen to call the plotting commands without any output arguments. Or if I just open a FIG file:
openfig('Fig1.fig')
There are a number of techniques you can use to get the handles of existing graphic objects:
- gcf - handle of the current figure. MATLAB has a concept of a "current" figure.
- gca - handle of the current axes.
- gco - handle of the current object. This returns the handle of the last clicked object. The object could be anything, including axes and figures.
- findobj - find objects with specific properties.
- findall - find objects (including hidden objects).
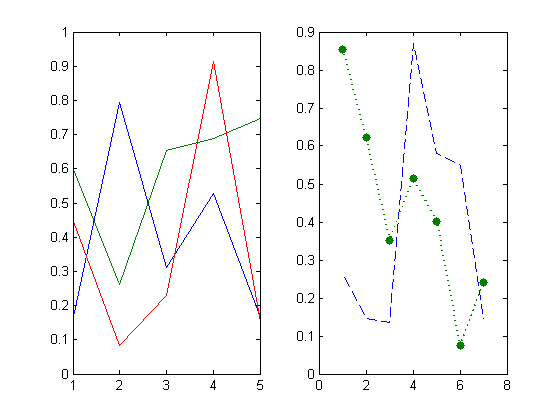
Give it a Try
- Open "Fig1.fig".
- Click on the green line with dots (on the right axes) and use gco to get the handle of the line object. Access and change some of the properties of the line.
- Find all lines with color blue:
h = findobj('Type', 'line', 'Color', 'blue')