Customizing Graphics Interactively
Table of Contents, Get code for this tutorial
Note: You can execute the code from this tutorial by highlighting them, right-clicking, and selecting "Evaluate Selection" (or hit F9).
In this tutorial, you will see how you can customize your graphs interactively.
Contents
Load Data
First, we'll load the data necessary for this exercise.
load data
Create Basic Plot
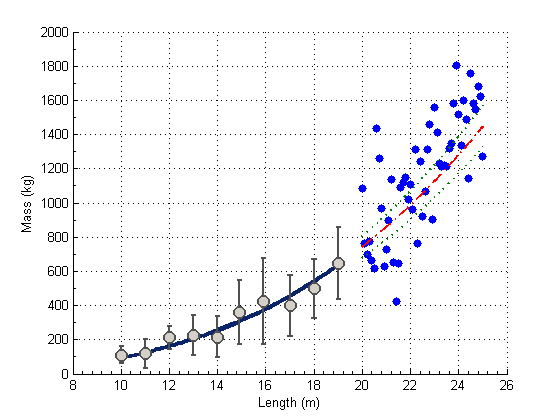
Next, plot the data to create the crude visualization.
figure();
hold on;   % hold the figure to plot multiple objects.

hFit   = plot(xfit  , yfit   );
hE     = errorbar(xdata_m, ydata_m, ydata_s);
hData  = plot(xVdata, yVdata );
hModel = plot(xmodel, ymodel );
hCI(1) = plot(xmodel, ymodelL);
hCI(2) = plot(xmodel, ymodelU);
Customize using Plot Tools
Open Plot Tools by clicking on the right-most button of the Figure toolbar.
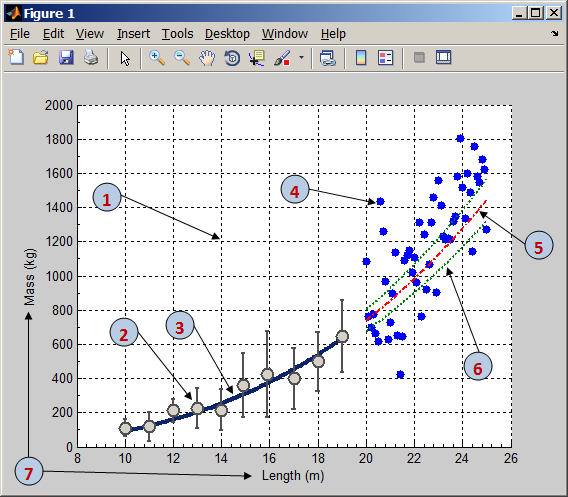
Make the following customization interactively in Plot Tools.
- Add X and Y grids
- Remove line from error bars. Add "o" marker. Change MarkerEdgeColor, MarkerFaceColor, MarkerSize, Color and LineWidth
- Change Color and make line thicker
- Remove line and add marker (increase MarkerSize)
- Change line color, line type, and line thickness
- Change line color, line type, and line thickness
- Add X and Y labels
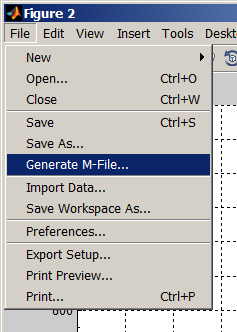
After you're done with customizing, close Plot Tools (click on the button next to the one that opened Plot Tools). Go to File menu and select "Generate M-File".
Calling Generated MATLAB File
Once the MATLAB file is generated, you can call it with the appropriate input arguments.
createfigure(xfit, yfit, xdata_m, ydata_m, ydata_s, xVdata, yVdata, ...
   xmodel, ymodel, ymodelL, ymodelU)