Customizing Graphics Programmatically
Table of Contents, Get code for this tutorial
Note: You can execute the code from this tutorial by highlighting them, right-clicking, and selecting "Evaluate Selection" (or hit F9).
In this tutorial, you will see how you can customize your graphs programmatically.
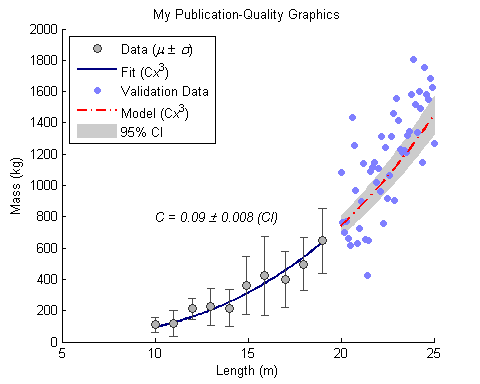
For this example, the final goal will be to create a publication-quality graph and export it as an EPS file (postscript) that is 5 inches wide and 4 inches tall.
This tutorial is based on this blog post "Making Pretty Graphs".
Contents
Load Data
Load the data necessary for this exercise.
load data
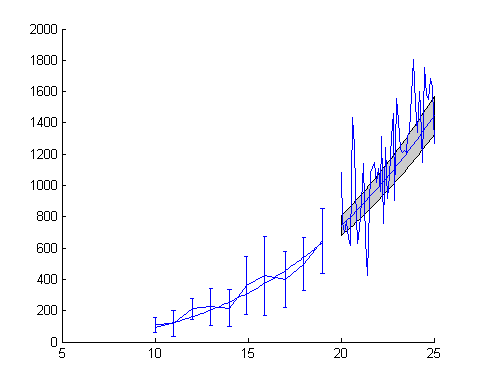
Create Basic Plot
First, plot the data to create the crude visualization. To ensure that the final dimensions (after exporting) are correct, specify with the "Position" property.
% 5 inches wide and 4 inches tall
figure('Units', 'inches', 'Position', [1 1 5 4]);
hold on;

hFit   = plot(xfit  , yfit   );
hE     = errorbar(xdata_m, ydata_m, ydata_s);
hCI    = patch([xmodel,fliplr(xmodel)], [ymodelL,fliplr(ymodelU)], ...
               [.8 .8 .8]);
hData  = plot(xVdata, yVdata );
hModel = plot(xmodel, ymodel );
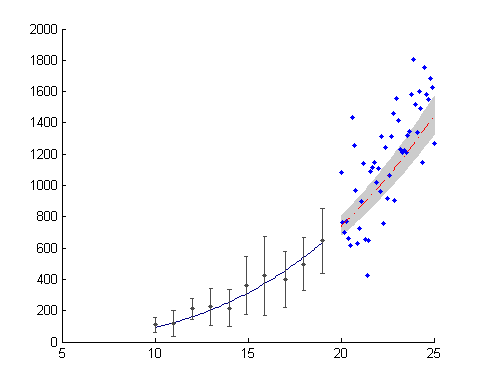
Adjust Line Properties (Functional)
Next, do the first-round modification. At this point, we're not worried about the aesthetics yet.
set(hFit                           , ...
   'Color'           , [0 0 .5]    );
set(hE                             , ...
   'LineStyle'       , 'none'      , ...
   'Marker'          , '.'         , ...
   'Color'           , [.3 .3 .3]  );
set(hData                          , ...
   'LineStyle'       , 'none'      , ...
   'Marker'          , '.'         );
set(hModel                         , ...
   'LineStyle'       , '-.'        , ...
   'Color'           , 'r'         );
set(hCI                            , ...
   'EdgeColor'       , 'none'      );
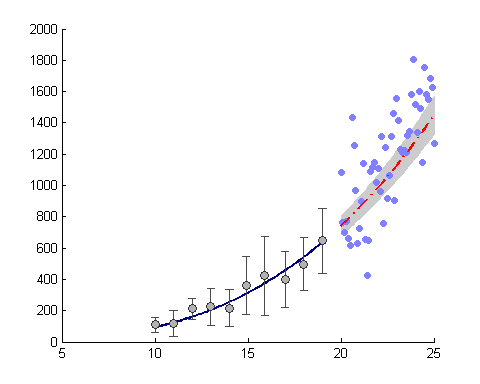
Adjust Line Properties (Aesthetics)
To make it more publication-quality, make the following changes to the line properties, including the errorbar widths. This is a preference, but using thicker lines and larger markers greatly improves the "look".
set(hFit                          , ...
   'LineWidth'       , 2           );
set(hE                            , ...
   'LineWidth'       , 1           , ...
   'Marker'          , 'o'         , ...
   'MarkerSize'      , 6           , ...
   'MarkerEdgeColor' , [.2 .2 .2]  , ...
   'MarkerFaceColor' , [.7 .7 .7]  );
set(hData                          , ...
   'Marker'          , 'o'         , ...
   'MarkerSize'      , 5           , ...
   'MarkerEdgeColor' , 'none'      , ...
   'MarkerFaceColor' , [.5 .5  1]  );
set(hModel                         , ...
   'LineWidth'       , 1.5         );

% adjust error bar width
hE_c                   = get(hE     , 'Children'    );
errorbarXData          = get(hE_c(2), 'XData'       );
errorbarXData(4:9:end) = errorbarXData(1:9:end) - 0.2;
errorbarXData(7:9:end) = errorbarXData(1:9:end) - 0.2;
errorbarXData(5:9:end) = errorbarXData(1:9:end) + 0.2;
errorbarXData(8:9:end) = errorbarXData(1:9:end) + 0.2;
set(hE_c(2), 'XData', errorbarXData);
Add Legend and Labels
No plot is complete unless it is well annotated.
hTitle  = title ('My Publication-Quality Graphics');
hXLabel = xlabel('Length (m)'                     );
hYLabel = ylabel('Mass (kg)'                      );

txt   = sprintf('{\\itC = %0.1g \\pm %0.1g (CI)}', c, cint(2)-c);
hText = text(10, 800, txt);

hLegend = legend([hE, hFit, hData, hModel, hCI(1)], ...
   'Data ({\it\mu} \pm {\it\sigma})' , ...
   'Fit (C{\itx}^3)'      , ...
   'Validation Data'       , ...
   'Model (C{\itx}^3)'    , ...
   '95% CI'                , ...
   'location', 'NorthWest' );
Adjust Font and Axes Properties
Since many publications accept EPS formats, select fonts that are supported by PostScript and Ghostscript. Anything that's not supported will be replaced by Courier. Also define tick locations, especially when the default is too crowded.
set( gca                             , 'FontName'   , 'Helvetica' );
set([hTitle, hXLabel, hYLabel, hText], 'FontName'   , 'Palatino');
set([hLegend, gca]                   , 'FontSize'   , 8           );
set([hXLabel, hYLabel, hText]        , 'FontSize'   , 10          );
set( hTitle                          , 'FontSize'   , 12          , ...
   'FontWeight' , 'bold'      );

set(gca, ...
   'Box'         , 'off'     , ...
   'TickDir'     , 'out'     , ...
   'TickLength'  , [.02 .02] , ...
   'XMinorTick'  , 'on'      , ...
   'YMinorTick'  , 'on'      , ...
   'YGrid'       , 'on'      , ...
   'XColor'      , [.3 .3 .3], ...
   'YColor'      , [.3 .3 .3], ...
   'YTick'       , 0:500:2500, ...
   'LineWidth'   , 1         );

Export to EPS
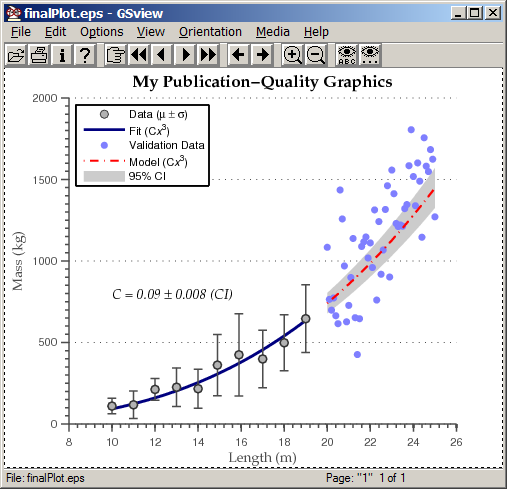
When exporting, the best way to specify the final dimension is to set the PaperSize and the PaperPosition properties. If you want a WYSIWYG behavior (adjust how you want it to look on screen), set the PaperPositionMode to auto. When exporting to a postscript format, select '-loose' option to make sure that the figure edge is not cropped.
% Make the paper size the same as the figure size (no extra borders)
set(gcf, 'PaperPositionMode', 'auto');
set(gcf, 'PaperUnits', 'inches', 'PaperSize', [5 4]);

print -depsc2 -loose finalPlot.eps
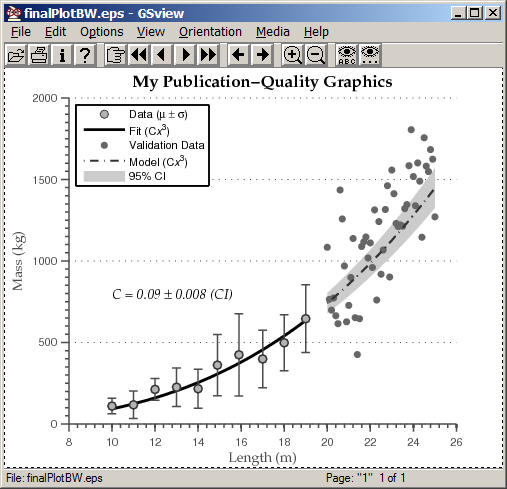
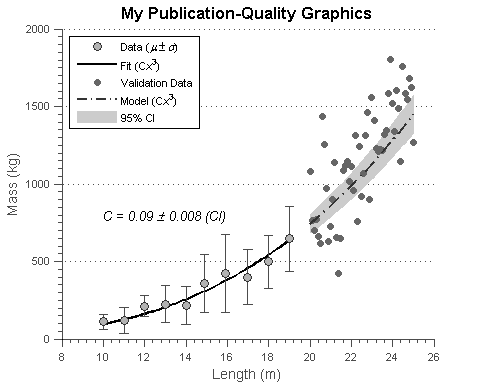
Export to Black and White (Grayscale) EPS
Many journals require figures to be black and white (or gray scale). To do that, convert all colors to gray scale and then export.
set(hFit  , 'Color'           , 'k'       );
set(hModel, 'Color'           , [.2 .2 .2]);
set(hData , 'MarkerFaceColor' , [.4 .4 .4]);

print -depsc2 -loose finalPlotBW.eps
Exported EPS file
The exported EPS file looks like this:
And the gray scale version: