Rocks Cluster Distribution: Users Guide: 
| ||
|---|---|---|
| Prev | Chapter 3. Monitoring | Next |
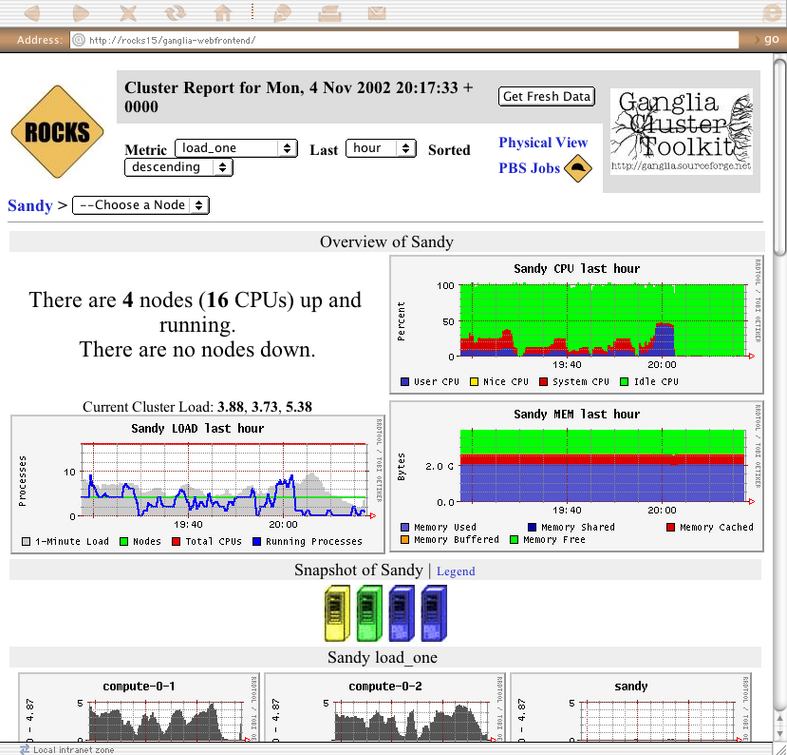
The webpages available from this link provide a graphical interface to live cluster information provided by Ganglia monitors running on each cluster node. The monitors gather values for various metrics such as CPU load, free memory, disk usage, network I/O, operating system version, etc. These metrics are sent through the private cluster network and are used by the frontend node to generate the historical graphs.
In addition to metric parameters, a heartbeat message from each node is collected by the Ganglia monitors. When a number of heartbeats from any node are missed, this web page will declare it "dead". These dead nodes often have problems which require additional attention, and are marked with the Skull-and-Crossbones icon, or a red background.
 | The Rocks Cluster Group maintains a similar web page called Meta that collects Ganglia information from many clusters built with Rocks software. It may give you a glimpse of the power and scalability of the Ganglia monitors. The meta page is available at http://meta.rocksclusters.org/. |
Ganglia was designed at Berkeley by Matt Massie (massie@cs.berkeley.edu) in 2000, and is currently developed by an open source partnership between Berkeley, SDSC, and others. It is distributed through Sourceforge.net under the GPL software liscence.