Rocks Cluster Distribution: Users Guide: 
| ||
|---|---|---|
| Prev | Chapter 3. Monitoring | Next |
Ganglia has the ability to track and present monitoring data from multiple clusters. A collection of monitored clusters is called a Grid in Ganglia's nomenclature. This section describes the steps required to setup a multi-cluster monitoring grid.
The essential idea is to instruct the gmetad daemon on one of your frontend nodes to track the second cluster in addition to its own. This procedure can be repeated to monitor a large set clusters from one location.
For this discussion, your two clusters are named "A" and "B". We will choose the frontend on cluster "A" to be the top-level monitor.
On "A" frontend, add the line to /etc/gmetad.conf:
data_source "Cluster B" B.frontend.domain.name |
Then restart the gmetad server on "A" frontend.
On "B" frontend, add the line to /etc/gmond.conf:
trusted_hosts A.frontend.domain.name |
Then restart the gmetad server on "B" frontend.
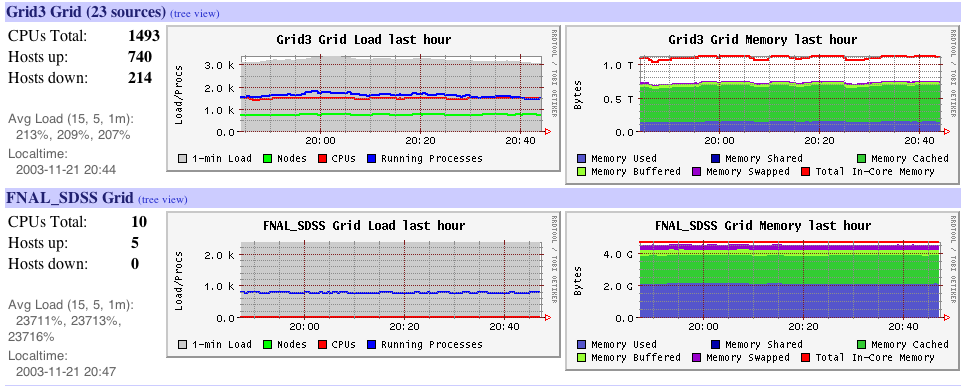
Take a look at the Ganglia page on "A". It should include statistics for B, and a summary or "roll-up" view of both clusters.
This screenshot is from the iVDGL Physics Grid3 project. It is a very large grid monitored by Ganglia in a similar manner as specified here.
