Text and Slides of the 45 min keynote lecture entitled:
World energy consumption and resources: an outlook for
the rest of the century
(and the role of thermodynamic research)
delivered by Gian Paolo Beretta, Università di Brescia,
Italy,
on Tuesday, Nov.4, 2008, 6:00pm, at the ASME
Congress in Boston,
sponsored by the Advanced Energy Systems Division.
Click
here for a printable PDF version.
1.
Greetings[1]
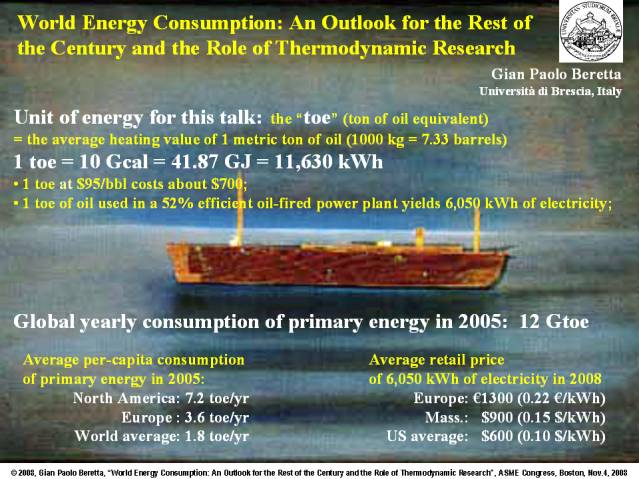
This initial slide sets the unit of measure of energy that is best
suited for the purposes of our discussion today: the ton of oil equivalent. The
toe. That is, the average heating value of one metric ton of oil, which is
about 7.3 barrels or 12000 kWh. The current global yearly consumption of
primary energy is about 12 billion toes. The average per-capita consumption is
7.2 toes per year in North America, while it is 3.6 in Europe and the world
average is 1.8.
2.
The outline of the talk is as follows. I will first review
historical data on past consumption of primary energy, together with some
social and economic data and considerations useful for an outlook. I will then
discuss a plausible scenario about demographic growth, energy needs, and mix of
primary resources for the rest of the century. We will compare this scenario
with data on currently proved and presumed energy reserves on our planet, to
decide whether we are really running out of fuel as media and politicians keep
saying. Next, we use the scenario to infer how much carbon dioxide will be
released by primary energy consumption, and discuss what impact this may have
on global warming.
I will then discuss the role of thermodynamics research, and I
will conclude with some provocative statements to spark up the discussion.
3.
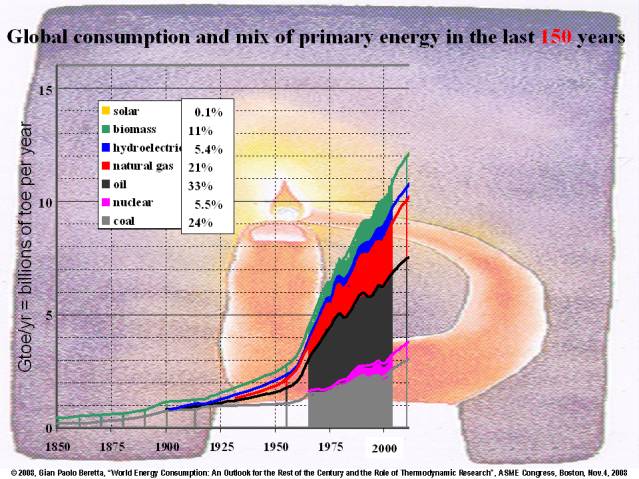
Let's start with the global energy consumption over the last 160
years. I chose to start from 1850 because that’s when the word entropy was
introduced by Clausius. Today, the global demand of about 12 billion toes per
year is covered for 78% by fossil fuels (33% oil, black in the figure, 21%
natural gas, red; 24% coal, gray), 5.5% by nuclear fuels (violet), 5.5% by
hydro (blue), while the remaining 11% are non-commercial biomasses (green),
like wood, hay and other forage which in rural-economies are still the main
resource. These rural biomasses are usually seldom considered in the usual
energy statistics by oil companies and international energy agencies, but in a
global framework they are part of the picture, because at least two thirds of
human kind still lives in rural and craft economies not much different from
those of the european middle age. Consider hay for animal feed. 160 years ago,
in the United States two-thirds of the mechanical work came from horses, and in
1925 the horses were still about 30 millions.
The direct use of solar energy and wind power (yellow in the
graph) is currently estimated at about 10-20 million toes (millions, not
billions) and so, on the scale of this chart it is invisible, since it meets
less than 0.1-0.2% of the global need.
4.
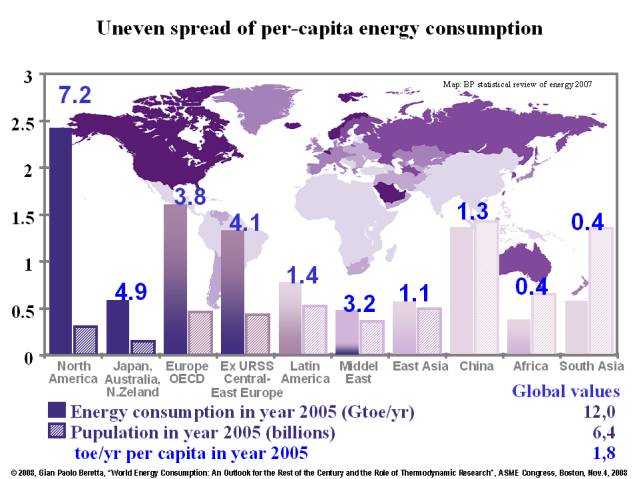
In this chart, which refers to year 2005, nations are divided into
10 groups homogeneous by type of economy, industrial development and intensity
of energy consumption. For each group of nations, the left bar is the yearly
consumption in billion toes; while the right bar represents the population, in
billions; and the numbers in blue at the top indicate the intensity of energy
consumption, expressed in toes per year per capita. Globally, in year 2005,
about 6.4 billion souls consumed about 12 billion toes, with an average
intensity of 1.8 toes per year per capita.
The graph shows very pronounced disparities in the intensity of
consumption. It varies widely from country to country, depending on many
factors such as the different geographical and climatic conditions, and
especially the level of development and industrialization, as we can infer by
taking a look at historical trends.
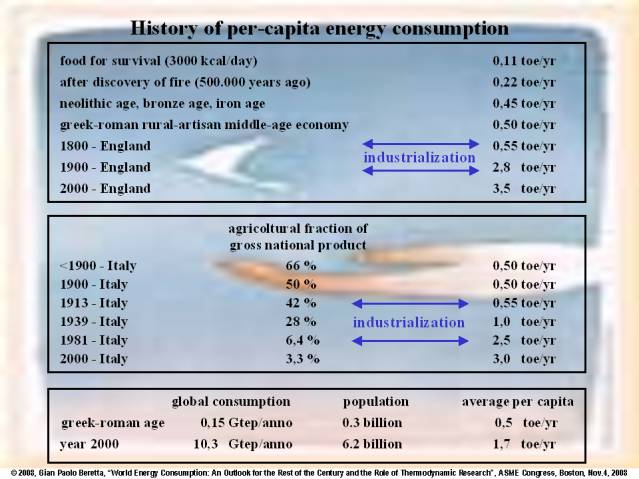
5.
If we consider the bare survival, an active human body requires
about 3000 kilocalories per day, equivalent to about 0.11 toes per year. It is
estimated that with the discovery of fire 500 thousand years ago, the per
capita requirement doubled to 0.22 per year. Another doubling, to 0.45, is
attributed to the Neolithic, due to additional consumption to heat the homes
that replaced the natural caves, to feed animals, for which it was necessary to
cultivate the fields, and later to extract and work bronze and iron. Within the
Roman Empire, the increase in demand was counterbalanced by the progressive
improvements in the efficiency of use. With the use of water to power mills,
wind propulsion to power ships and then also wind mills, and with the use of
oil and bituminous products for lighting, the per capita consuption settled to
about 0.5 toes per year, and did not change much until the 19th century. But
then the transformation from rural to industrial economy in very delimited
geographic areas, beginning with England, involved a rapid increase in the
demand for coal. From 0.55 up to 2.8 toes in one century in England. In the
next century, following complete industrialization, even if GDP more than
doubled, the per capita energy demand grew only up to 3.5 toes per year.
In the case of Italy, from the rural-and-craft greek-roman economy
to about 1900 there was no substantial change in the per capita consumption:
0.5 toes per year, mainly from renewable sources. Industrialization started
around 1913 and was complete by 1981, with the gross agricultural product down
from 42% to 6.4%, and, like in England during industrialization, the per capita
energy consumption up to 2.5 toes per year, by a factor of five.
Overall, in the last two millennia, the global demand of energy
had a 70-fold increase, the population a 20-fold increase and the per capita
consumption little more than a 3-fold increase (from 0.5 to 1.7 toes per year).
The transition from renewable energy sources (wood and forage) to massive use
of fossil fuels, has accompanied and allowed the processes of development and
industrialization, which allowed profound changes in the quality of life.
So, industrialization, and its direct correlation with per capita
energy consumption, is a key factor in attempting a reasonable forecast.
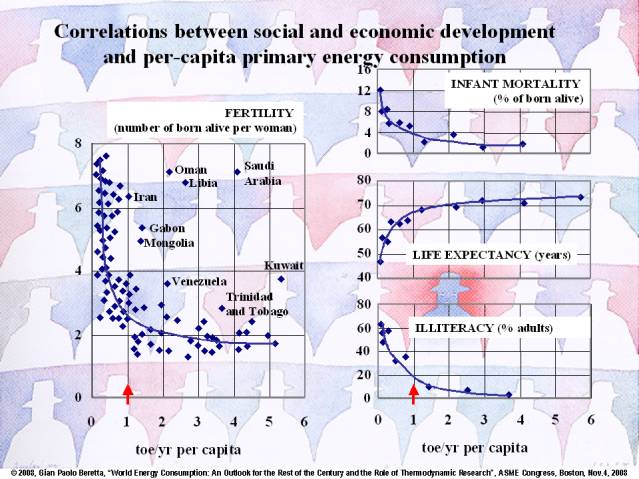
6.
There is a strong inverse correlation between the per capita
consumption of energy, and various factors and indicators of social and
economic development, especially the fertility rate and hence the rate of
population growth. Energy allows improvements in the standard of living, broad
access to health care, use of contraceptives, longer life expectancy, services
that increase the level of literacy and access to information, working
opportunities for women. The per capita energy consumption emerges therefore at
the same time as an index and as an instrument of social and economic
development. A most important feature of industrialization is the lesser need
to have many children and numerous families, which in rural societies is
necessary for survival and to sustain the unproductive members of the group, children
and the elderly. Countries with high standards of living and higher per-capita
consumption, have very low or no population growth. Underdeveloped countries
have high growth rates, sometimes doubling the population every 25 years. These
graphs show that an important threshold in the development seems to be at one
toe. Social conditions improve, life expectancy reaches 70 years, fertility
decreases and population growth slows down. Having many children becomes a
luxury, that only exceptionally reach countries can afford.
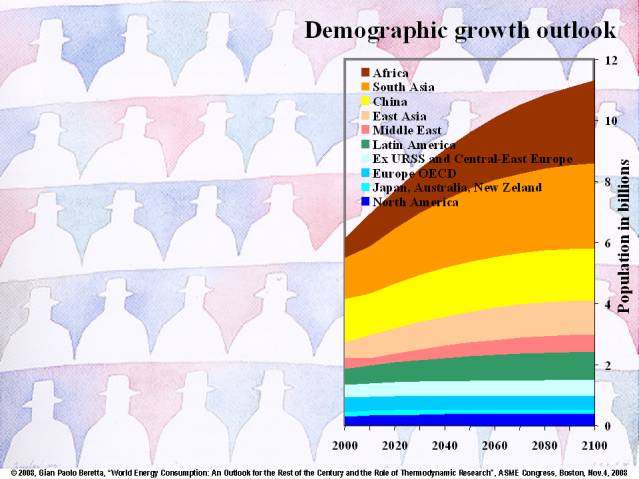
7.
Clearly there is no room on Earth for an indefinite population
growth. Most studies agree with the estimate that a sustainable future for our
planet requires the global population to stabilize around no more than twice
the current population and that this will occur during the current century. But
population growth rates will vary greatly from region to region of the planet,
depending, as we have seen, on the current stage of development. On this basis,
the chart shows the expected population growth for the rest of the century, for
each of the 10 groups of countries we already identified.
We will pass from 6 to 11 billion people. Growth will stabilise in
all countries, soon after they pass the threshold of 1 toe per year per capita.
Africa and South Asia today host a third of human kind, at the end of century
they will host a half. North America, Japan, Australia, New Zealand, Europe and
former Soviet Union states, will drop from todays overall 22% to only 13%.
8.
While this social and economic development takes place, also
technological development continues. The efficiency of exploitation of energy
resources, and of all end uses of energy carriers, will continue to improve.
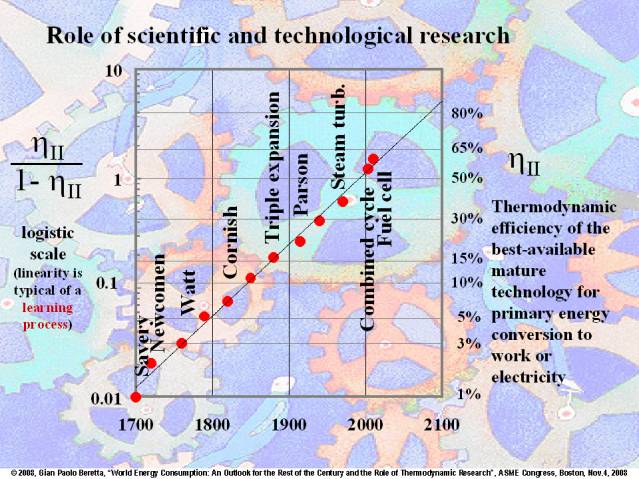
This graph shows how technical and scientific research has
resulted in a steady improvement of energy conversion machines. The chart spans
the last 300 years, from the first steam engines at the dawn of the industrial
revolution in England, to the modern combined-cycle power plants and fuel
cells. On the right scale, it shows the thermodynamic effectiveness of the
best-available mature technology for converting fossil-fuel availability into
mechanical work and electricity, which is now around 60%. We are talking here
of the thermodynamic effectiveness which we also call ‘second-law efficiency or
exergy efficiency’. The scale of this graph is not linear in the effectiveness
itself, but in the logarithm of the ratio of the effectiveness to one minus the
effectiveness, as shown on the left of the graph. The fact that it is a
remarkable straight line on this so-called logistic scale, is a typical feature
of any learning process. The importance of this obvious correlation of
historical data, is that it shows at which rate progress will continue. We can
be quite confident that by the end of the century, we will have mature energy
conversion technologies, with thermodynamic effectiveness well over 80%. If we
show the same data on a linear scale, the graph would look as follows.
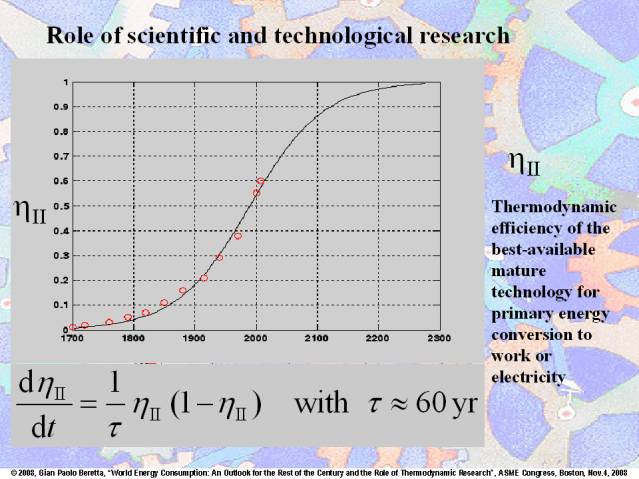
9.
The typical S-shaped curve of a learning process; where the
learning rate is at any time proportional to the current effectiveness and the
current room for improvement. The time constant turns out to be about 60 years.
Sixty years to change the ratio of eta over one minus eta by a factor of e.
Sixty years to go therefore from the current 60% to 80%. This graph is very
exciting, especially for people like us who work in thermodynamics: you see, we
are still just past a half of our learning process about understanding and
mastering the laws of thermodynamics. That's why we thermodynamicists are still
going to be in business for a long while.
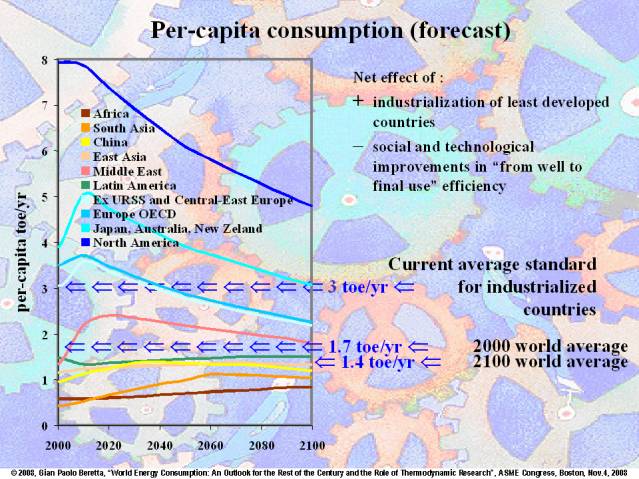
10.
Similar improvements will of course obtain also in all the
end-uses of energy, so that at the end of the century the overall life-cycle
efficiency will be doubled, that is, the current standard of living, possible
today in Europe with a per capita consumption of 3 toes per year, will require
only 1.5. Here is a scenario of trends of per-capita consumptions for the same
10 groups of countries already cited. Countries that are already industrialized
will improve their efficiencies, and contribute to better efficiencies in
developing countries, partially mitigating the sharp increase intrinsic in
their process of industrialization. Overall, from the 1.7 world average at the
beginning of this century, we will end the century with a world average of only
1.4, in spite of the industrialization of most of the globe.
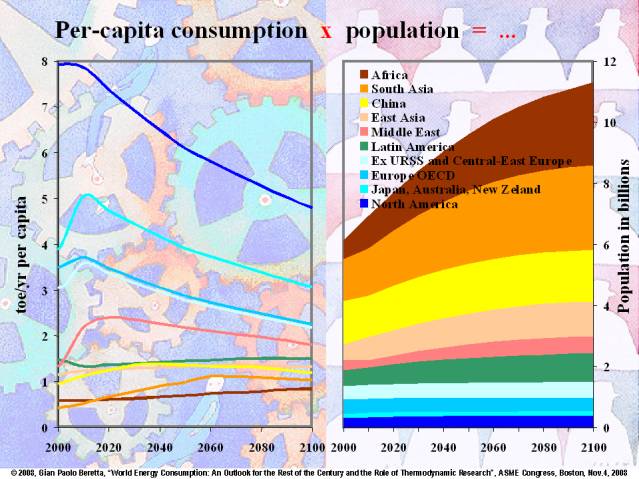
11.
Well, we can now combine this chart with the one about demographic
growth we just discussed, and multiply, for each group of nations, the per
capita demand by the expected population. Thus we get an estimate of the energy
needs for each group of nations.
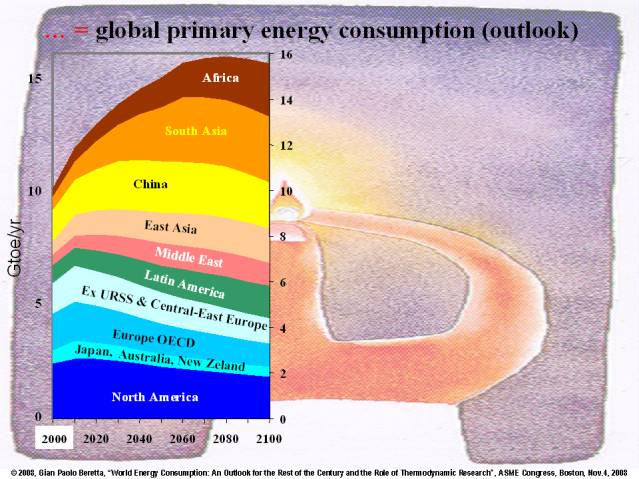
12.
Here is the resulting scenario. The global demand will keep
growing quickly for a few decades, but then will stabilize at the end of the
century to a value of about 16 billion toes against the current 12 billions.
The impact of the most industrialised nations will grow slightly in the first
two decades, but then will reduce to 3 / 4 of their current needs. Compared to
global needs, however, the marginal impact of today's most industrialized
countries will fall from 60 to 28%. Instead, Africa and South Asia will rise
from 10 to 33%.
Given this forecast of energy needs, a much more disputable affair
is to predict how the mix of energy resources, used to satisfy them, will
evolve. The various possible scenarios depend on many variables, especially the
geopolitical context that will develop. But a most important factor, is the intrinsic
inertia of the energy market.
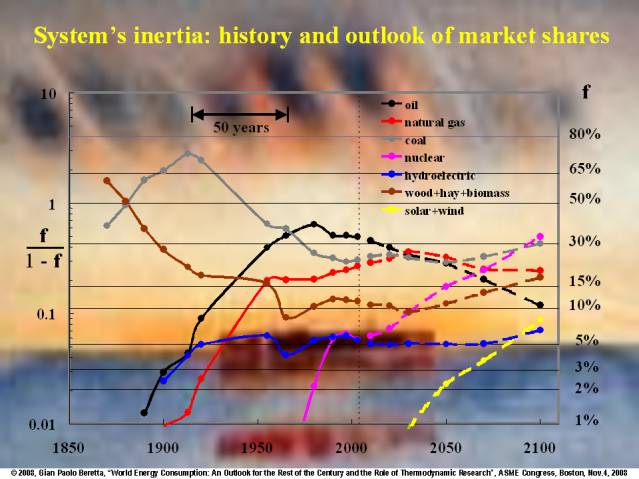
13.
This graph shows the historical trends of the market shares of the
various primary sources, again shown on a logistic scale, namely a scale linear
in the log of f over one minus f, where f if the market share of each resource.
The laws of the market have resulted in the gradual competition
and replacement of resources, from wood and rural biomasses to coal, from coal
to oil, to the current mix of resources that sees gas about to overtake oil.
The slopes on this chart warn about the huge inertia of the economic and energy
technology system. We need tens of years for a new resource to reach a
significant market share. The very life of production facilities ranges from 20
to 40 years. It is obvious that the inertia of the system involves long
response times and long-term returns of investments.
So, taking into account this intrinsic inertia…
...here is a plausible scenario for the future mix. It is very
balanced I believe, though quite optimistic in some ways.
While natural gas will overtake oil in about 15 years from now,
coal will maintain its share and will overcome both in about 50 years, because
it will be used with increasingly clean technologies. Nuclear energy will
continue to grow in the (optimistic) hypothesis that the geopolitical context
will stabilize, allowing for ways to manage the military risks, and that
technology will solve current environmental safety and radioactive waste
management concerns. Notice how solar and wind will gradually climb up to a
sizable fraction. And also how biomasses will keep their market share, as there
will be a shift from rural biomasses to industrial ones such as switchgrass and
solid wastes.
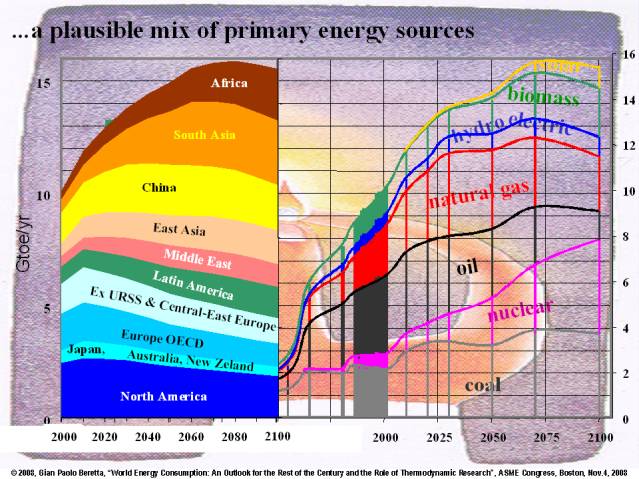
14.
Let’s view this scenario in a more natural graph showing how the
mix of energy resources will match the predicted energy demand.
So, oil consumption will peak in about 15 years and then will
start to very slowly decline, due to the progressive but slow depletion of the
current wells, and the decreased rate at which new wells are found. Natural gas
and 'clean' coal will take up oil's role and will alternate as the predominant
resources of the century. Probably also some non-conventional oil resources,
such as tar sands, bituminous shales, heavy crudes and methane hydrates, will start
contributing.
Renewable energy consumption will increase, thanks to increasing
deployment of hydroelectric resources, increasing 'sustainable' uses of
biomasses and solid wastes.
Direct solar power, wind power, tidal power and other renewable,
or better, quasi-inexaustible resources, will certainly increase significantly,
but they will keep a marginal role for the entire century.
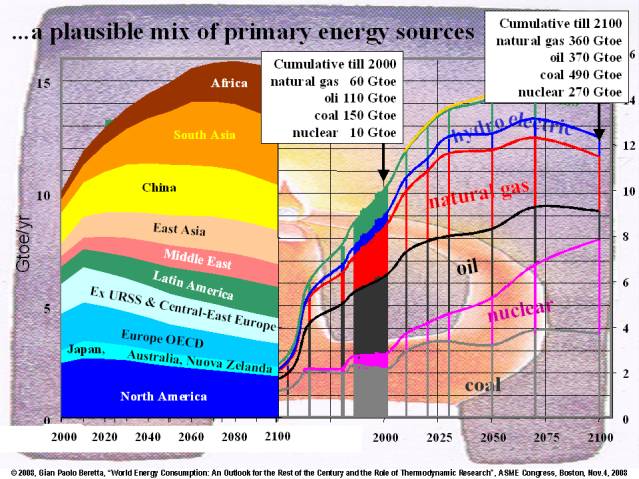
15.
A practical consequence of the inertia of the system, is that any
uncoordinated local or national energy policy, not well-weighted and
well-concerted internationally and globally, cannot possibly change the course
of the system. Not only such a local energy policy would be ineffective and
dissipative, but it could even reduce the confidence of operators in the
stability of the economic and regulatory context in which they are called to
make investments. For this reason, I am not so sure that federalism and free
market are good ideas in the energy business; the french have it right.
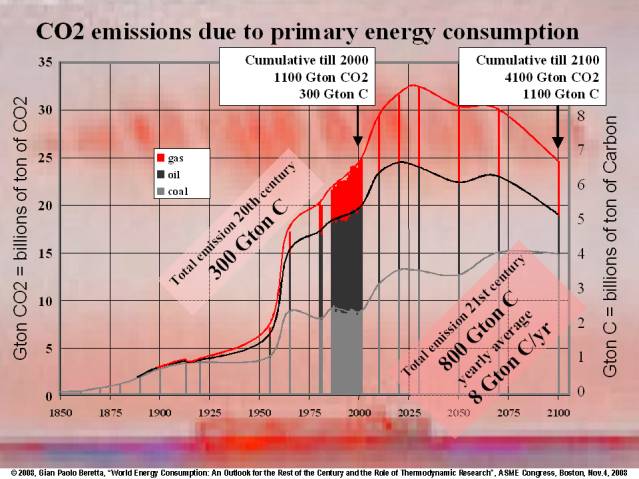
Well, anyway, from this scenario of demand and mix of resources,
we can calculate the cumulative consumptions per resource at the end of the
century. These are written in the top right box. Compare them with the
cumulative consumptions so far, in the box at the center. In the next slide, we
will compare these numbers, with current estimates of the available reserves,
of fossil and nuclear fuels, to decide if we have enough inventory to satisfy
the predicted demand of each resource.
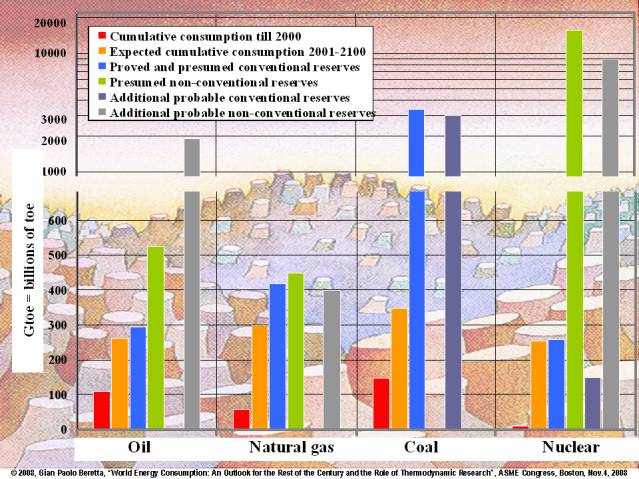
16.
Here is the histogram that compares past consumption and future
demand with the known reserves of oil, natural gas, coal and nuclear fuels. The
red bars indicate how much we have already consumed up to the last century, the
orange bars how much we will consume in the current century (according to the
scenario proposed), and the blue bars indicate conventional reserves, that are
considered either proved or highly probable at current prices.
Further bars indicate the resources that with today's methods are
considered non conventional and not potentially recoverable, but that
presumably could be developed on the time scale we are considering, which
includes breeding fission technologies and the Thorium cycle.
It is quite clear that reserves will last well beyond the current
century.
Thus the allegation that primary energy reserves are scarse, which
is constantly repeated by the press, by politicians at all levels with obvious
demagogic purposes, and by aggressive futurologists whose sole interest is to
sell their books and speeches, is clearly false and unfounded. There is no
shortage that will prevent or impede the impressive social and economic
development expected in this century by the emerging countries. When a resource
gets scarce, the markets will adjust, but we will not remain out of fuels for
very long time.
And we didn't mention nuclear fusion here as an option, because of
the difficulties it still encounters in the labs and because of the decades
that will separate physics laboratory demonstration, from engineered industrial
installations, and from gaining a sizable share of the market. In any case, we
all know that reserves for fusion would be plentiful, as Lithium is a most
abundant element.
So, the concern is not scarsity, but rather the fact that in the
long-term the second most abundant resource (after breeding nuclear fission) is
coal. Well-known environmental concerns derive from the hypothesis, that the
amounts of greenhouse gases introduced in the atmosphere by anthropic
exploitation of fossil fuels, may significantly influence the thermal balance of
our planet, affecting clima and melting polar ice-caps. This hypothesis is in
fact pushing towards more energy consumption to seize and confine part of the
carbon dioxide released by the oxidation of fossil fuels.
17.
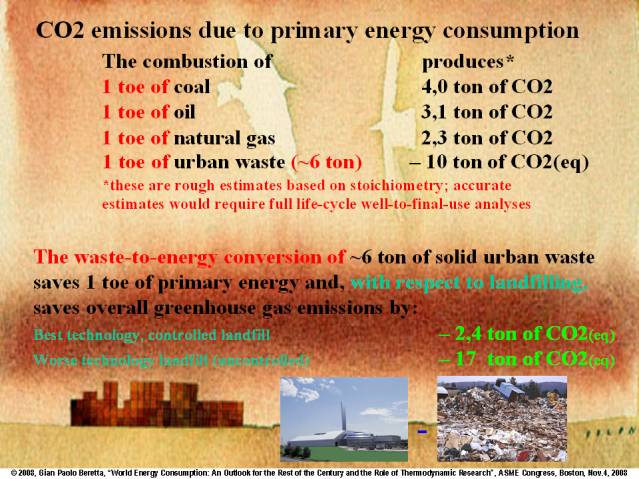
Indeed, for each toe of primary energy obtained by oxidation of
fossil fuels, the carbon dioxide emission can be estimated to a very first
approximation, by simple stoichiometry. It is 4.6 tonnes of CO2 for coal, 3.1
for oil and 2.3 for natural gas. Better numbers would require considering the
full life-cycle, from-well-to-final-use, of each of these fuels. In the next
slide, we will apply these rates to estimate the overall CO2 emissions implied
by our scenario.
Before that, however, I would like to make a brief digression on
the role of waste-to-energy technology, with respect to greenhouse gas
emissions. Municipal wastes are composed for almost 80% of biomasses, and as
such they can be considered a mainly renewable resource. In Brescia, in Italy,
where a top technology, very clean, waste-to-energy cogeneration power plant
has been operating for ten years now, 1 toe of primary energy is saved for
every 6 tons of waste which is burned. In terms of greenhouse gas emissions,
with respect to current average landfilling technology in Italy, that also
means saving about 10 tons of CO2 equivalent. So, waste to energy can give an
important contribution. But keep in mind that if we burnt all our wastes in
power plants like the Brescia one, the primary energy savings would not exceed
2%, although the greenhousegas reduction would be about 5%.
18.
Ok, back to the anthropogenic CO2 emissions for the next century.
This is our predicted scenario. If during the last century human
kind has released a total of 300 billion tonnes of carbon in the form of CO2,
in the current century we will release another 800 billion tons, an average of
8 billions per year.
This anthropogenic release due to primary energy consumption, is
certainly not a negligible amount, but it is a relatively small fraction of the
complex natural balances and exchange mechanisms, by which carbon accumulates
on the surface of our planet and in the ocean depths, determining the natural
concentration of CO2 in the atmosphere.
19.
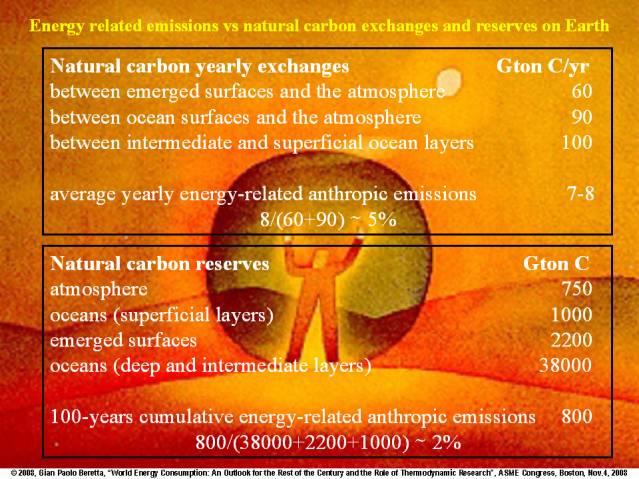
The 8 billion tons of annual, anthropogenic, energy-related
emissions, are about 5% of the amounts exchanged every year in the natural
carbon cycles, regulated by the production of biomass for photosynthesis,
decomposition of biomass plants and animals, and mass exchanges accompanying
seasonal temperature changes. Every year, the atmosphere exchanges 60 billion
tons of carbon with the land surface and 90 billions with the upper layers of
the oceans, which in turn exchange about 100 billion tons with the intermediate
and deep layers. The deep ocean is very important because carbon dioxide, which
is heavier than both air and water accumulates in large and stratified amounts
in the ocean’s depths.
So much so, that one of the first ideas for segregating the CO2
produced from oxidizing fossil fuels, has been to separate it from the products
of oxidation, solidify it into dry-ice, and drop it down in deep ocean (8-9
thousand meters) where the absence of convective mixing and the high pressures,
maintain very large and stable viscous lakes of supercritical carbon dioxide.
Today the atmosphere contains about 750 billion tons of carbon in
the form of CO2, the surface layers of the oceans contain 1000 billion tons and
the earth's surface 2200, while the deep ocean layers contain 38000. So, the
overall cumulative anthropogenic emissions during this entire century, which we
predicted to be 800 billion tons, amount to about 2% of the overall natural
reserves of carbon, but are about 20% of the surface amounts.
Of course, what matters are the rates at which these natural mechanisms
can metabolize the amounts of new CO2 we keep injecting.
20.
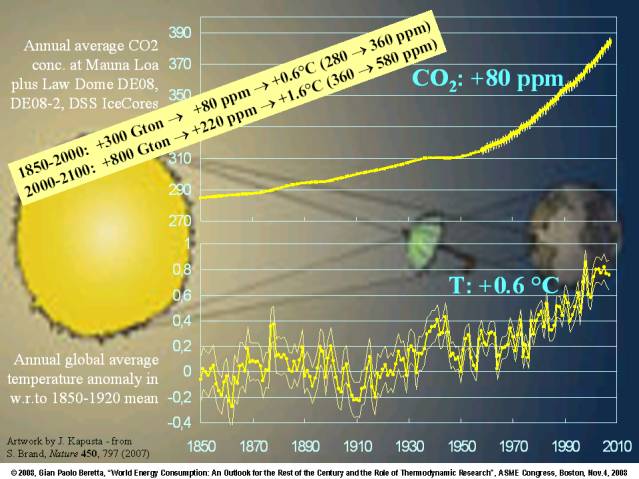
Of the 300 billion tons we emitted during the past century, only
about 45% have been metabolized. We infer that from the fact that the remaining
55% have accumulated in the atmosphere, causing an increase in CO2
concentration of 80 ppm, from 280 to 360. Assuming the phenomenon is still in
its linear phase, as suggested by the fact that the anthropic contribution is a
small fraction of the natural mechanisms, we infer that still only about 55% of
the additional 800 billion tons we will inject in this century, will remain in
the atmosphere, meaning that the concentration will go up another 220 ppm, to a
final 580. If we believe in the apparent direct proportionality between
increase in CO2 concentration and increase in average surface temperatures,
then we would predict another 1.6 degrees Celsius temperature increase, on top
of the 0.6 degrees already occurred, with all the climatic changes that will
follow.
 21
21
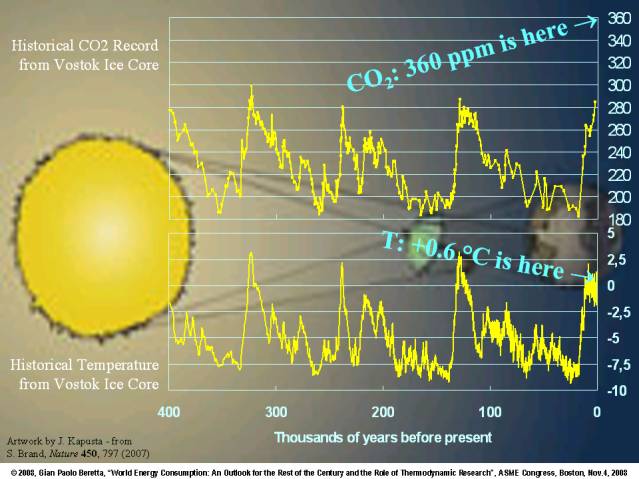
Looking at the well known data obtained from Antarctic ice cores,
we see from the upper graph that CO2 concentrations have never gone above 300
ppm in the past 400 thousand years, while it was above 300 ppm during most of
the past century. So, indeed, this anomaly may well be correlated with our
industrialization, and these data are compatible with the view that anthropic
emissions are to be held responsible for the climatic changes.
Other evidence, however, shows that at the end of the last ice
age, deep-ocean temperatures warmed up 1000 years earlier than the tropical
surface ocean, well before the rise in atmospheric CO2. This findings suggest
that the rise in greenhouse gases then, was rather a result, of warming, than
its main cause, although later on it is likely to have accelerated the meltdown
by positive feedback.
So, some doubts remain that the enormous costs and efforts, also
in terms of additional primary energy consumption, that are necessary to obtain
significant reductions in greenhouse gas emissions, could be easily rendered
vain by small fluctuations in the many broad natural mechanisms that regulate
the thermal equilibrium of our planet.
But we should probably accept such costs during the current
transition century and view them as buying us an insurance policy, until we
understand better if we can do without it.
22.
It is important though that legislators, politicians, media, and
ultimately the people, should not lean on disinformation or cheap futurology,
and should not be tempted by false promises of easy solutions. Decision makers
and everybody else should never forget the characteristics of complexity,
inertia and globality, of the social and economic context, in which the energy
and environmental problems are embedded.
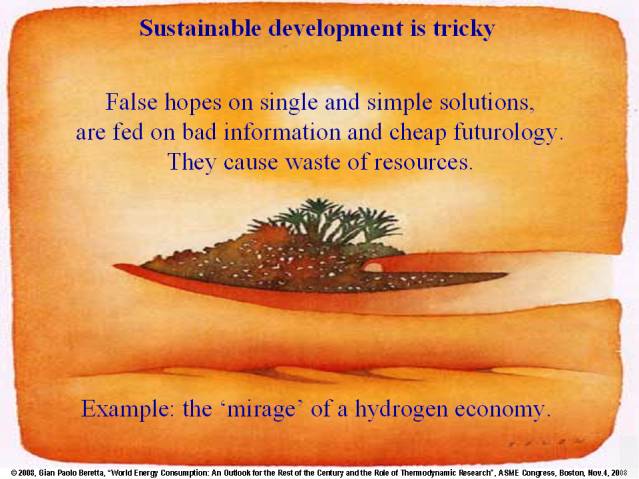
For example, especially in Europe, in the name of sustainable
development, a lot of research money has been attracted to the mirage of the
so-called hydrogen economy. The idea that the synthetic production of hydrogen
fuel from water, could serve as an energy carrier, alternative and better than
electricity, is illusory and misleading. Electrical energy, even if produced by
wind turbines or solar photovoltaics, is very valuable. If we use it to split
water into hydrogen and oxygen, to recombine them later on in a fuel cell, we
waste more than half the electricity we started with. Such a poor use of
electricity ought to make sense only in very marginal situations, certainly not
to thrive an economy.
23.
To decide whether to invest on hydrogen cars or on battery
operated electric cars or hybrid vehicles, we must take into account the entire
energy life cycle, from well to wheel, and we must compare the alternatives on
equal grounds.
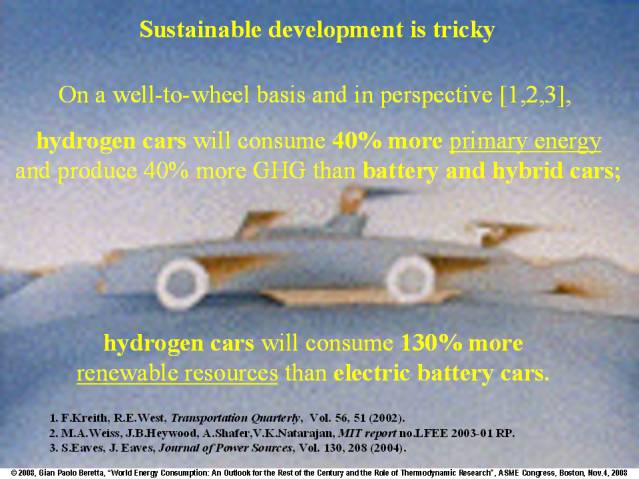
The data proposed by automotive experts, seem to confirm that
electric battery and hybrid cars are the least consuming, on a well-to-wheel
basis. If the primary energy used to produce hydrogen and electricity is a
fossil fuel, the best hydrogen car combination consumes 40% more, which means
also 40% more CO2 emissions. If instead we start from electrical energy, generated
for example by wind turbines or solar photovoltaic cells, the prospect for
hydrogen cars is even worse, as the best combination consumes more than twice
than an electric battery car.
So, I don’t know how it could happen that so many politicians and,
more surprisingly, most american and european car industries, preferred to
invest on fuel-cell hydrogen car research than on the development of better
electric batteries and hybrid vehicles, especially as they were all aware that
some japanese carmaker was betting on hybrid cars.
24.
Well, in the growing community of advanced energy systems and
thermodynamics experts, we probably all agree that choices made in the name of
sustainable development should be based on full-life-cycle analyses that
consider for each option the full sequence of processes, from primary energy to
final use. However, there is still some discussion as to how such life-cycle
analyses should be made. We all know a couple of colleagues in this audience
who would seldom agree on the details.
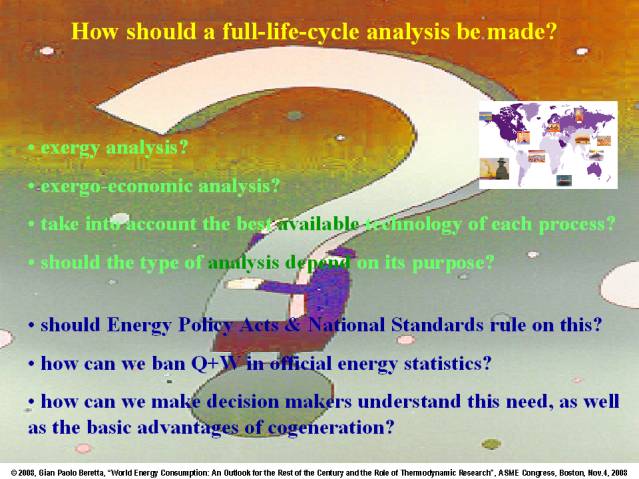
25.
The questions being discussed are. Should we just make a plain
exergy analysis? Or an exergo-economic analysis? Should we also take into
account the thermodynamic effectiveness of the current best available
technology for each of the processes in the sequence we wish to analyse? Should
the choice of the method of analysis depend on its purpose?
While we keep discussing these questions within this and other
technical groups, however, our mission should also be to lobby for better
legislation and regulations that could ease and promote investments in
efficiency improvements in all sectors, and improve the general understanding.
For example, in the US, after the oil embargo crisis, in 1973, it
took four years of lobbying actions to obtain the 1978 Public Utilities
Regulatory Policies Act (known as PURPA) that finally made it at least possible
to deploy cogeneration. Later on, there have been some amendements with the
Energy Policy Acts in 1992, 2005 and 2007. These regulations notwithstanding, not
only cogeneration is still not as widespread in the US as it is for example in
Europe, but most national agencies still report statistics on energy
productivity in the misleading language of the simple energy balance. For
example, the US Energy Flow Charts compiled until very recently by the Lawrence
Livermore National Lab add up heat and electricity on equal footing, they
simply add energy used in the form of residential and industrial heating, to
energy used in the form of electricity. This results in making the overall US
efficiency of primary energy consumption appear to be about 37%, while simple
exergy considerations prove that it is well below 20%. Only a week ago, I heard
George Hatsopoulos give a public speech on the future of engineering. Well, he
didn’t waste the occasion to explain why it is a crime to add heat and
electricity in such statistics, essentially because it is a crime to burn a
fuel and just get heat out of it, instead of using it better in a cogeneration
facility. Of course, our friend and mentor was effectively lobbying, as he
still owns a company producing cogeneration equipment… But he is also a
profound thermodynamicist, and he never spares some good thermo lessons to the
general public and the decision makers in his audiences. Each of us should not
get tired of doing the same.
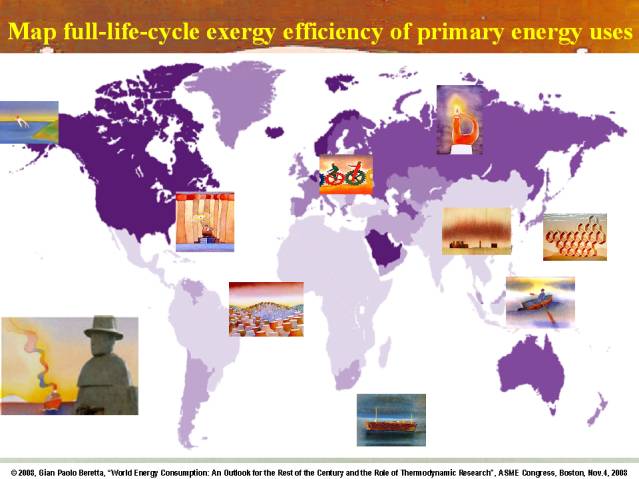
26.
For example, an interesting contribution we might push for, is to
generate a map, similar to the map showing the uneven spread of per-capita
consumption around the world that we have seen earlier; a map representing
instead good estimates of the average exergy efficiency of overall
primary-energy use in each nation, so as to correlate it with the level of
industrialization, the per-capita consumption and other economic indicators. Of
course, such analyses would require a huge effort, not only to get the data,
but also to overcome the political resistance against a tool that would spot
the good from the bad actors.
27.
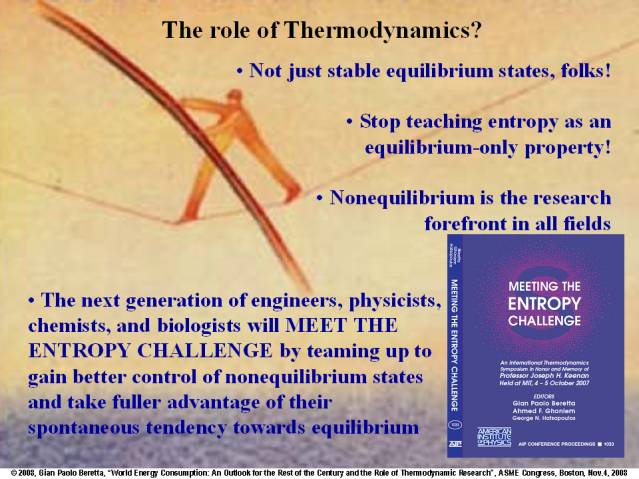
Now. What’s the role of thermodynamics? Well, many of you will
remember that about thirthy years ago, most of the science and engineering
community used to say that thermodynamics is a ‘dead subject’, that it deals
only with equilibrium states, and all that is to be said about equilibrium has
already been said. The last ten years proved that they were dead wrong. Each of
us may have different reasons, but we are all convinced now that thermodynamics
is back, up and strong. First of all it is fostering, as we have seen, the
transition to energy technologies that will make our globe more exergy
efficient. But in doing so, it is also participating to another scientific
revolution.
Perhaps thermodynamics is the only discipline that not only has
survived, but has played a key guiding role in three and a half scientific
revolutions. The first was relativity: classical mechanics was hit hard then,
but thermodynamics survived. The second knock down was quantum theory:
classical mechanics never got up again and relativity is still struggling its
quantum-gravity way-out, instead thermodynamics was not touched, rather it
contributed to the birth of quantum theory. Then came the half revolution about
information theory, convincing most people that entropy is just a subjective
measure of how much we know about the true physical state of the system; but
fortunately that ended when also physicists finally convinced themselves that
‘information is physical’.
The third revolution is the nonequilibrium revolution: we are
still at the dawn of this one, but it’s pervading all science and engineering
disciplines: biology, biomedicine, bioengineering, chemistry, electrochemistry,
interface phenomena, fluid mechanics, and heat and mass transfer, at all
scales. Thermodynamics plays a central role again in all these. The very large
crowd who used to be firmly convinced that entropy can be defined only for
equilibrium states, because all authors said so in their books, are slowly
convincing themselves that entropy does play a central role, and is well
defined also for nonequilibrium states. Many of you are still teaching entropy
as an equilibrium-only property, but that’s because you are either secretly
working on the next edition of your thermo book that will include our
nonequilibrium definition, or you are simply lazy and are just waiting for
someone else to do it for you.
Anyway, the international symposium we held last year in memory of
the late professor Keenan, proved that thermodynamics has returned to be at the
forefront of research in all fields. The next technological transition, will
feature engineers, physicists, chemists, and biologists teaming up together to
devise efficient ways to gain better control of nonequilibrium states and thus
take fuller advantage of their spontaneous tendency towards equilibrium. In
energy research this is already under way, and is feeding the transition from
traditional flame combustion, to multi-step combustion and fuel-cell oxidation
integrated with the thermal-cycle. It is also under way in many other fields
that will impact on the exergy efficiency of many final uses of energy.
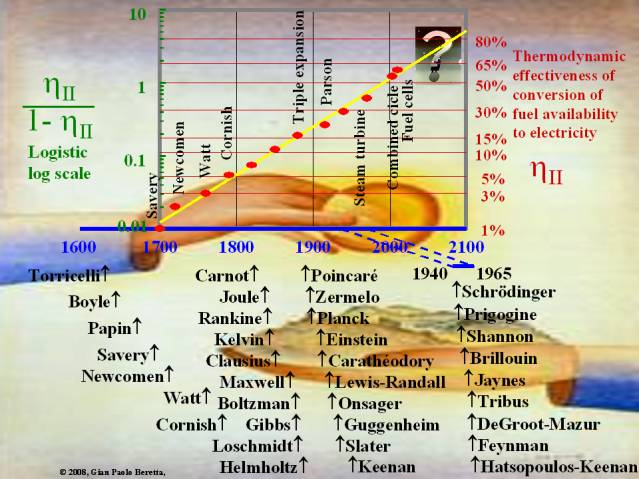
28.
Now, let’s return to this very exciting diagram about the logistic
historical growth of the exergy efficiency of the best available mature
technology in fossil fuel conversion to work and electricity. It is a monument
to our consistent improvements in the way we used the talents that Nature gave
us in the form of primary resources and brain. Below the time axis, in this
version of the chart, I added a selection of pioneers whose intellectual
contributions were directly or indirectly instrumental to achieve this
impressive steady progress.
You may observe that the names I selected, with few exceptions,
are not those of the inventors of new equipment, but of the fathers of
thermodynamics science. This is because many big dents in innovation often find
their seeds in new science, which provides better fundamental understanding.
Once we gain a better understanding, we can transform it into ideas to better
control the natural phenomena, and finally to design new more efficient
equipment.
In fact, noone of course knows today what technology will prevail
in providing the expected transition from 60 to 80% efficiency in the next
sixty years. But a few advances in that direction have already been made, at
least on paper or at the experimental stage. The direction in which we should
move is again indicated by thermodynamics: we need to find ways around the
intrinsic inefficiencies of our current flame-based technologies.
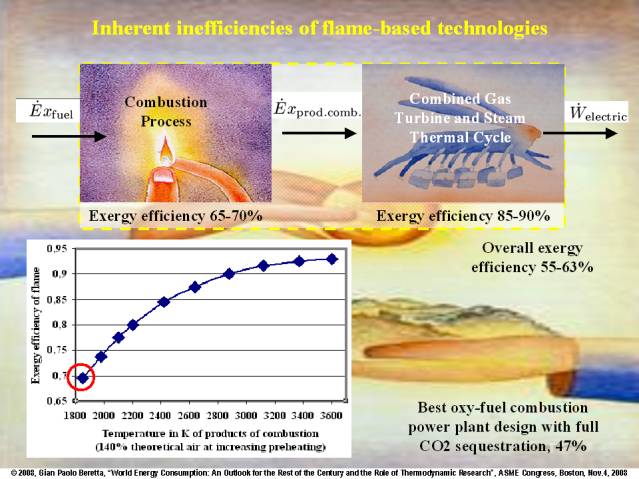
29.
As we all know very well, the current technologies based on
burning our primary fuels, have an inherent source of inefficiency in the flame
itself. For example, in a combined-cycle power plant, the combustion
irreversibilities eat up about 30% of the fuel exergy, while the remaining
irreversibilities in the entire power plant account for only a small additional
10-15% of exergy loss. Multiplying the 70% efficiency of the flame by the 90%
efficiency of the thermal cycle, yields the 63% overall efficiency which today
a few full-size power plants achieve.
The important lesson here is that if future technology will indeed
reach 80% overall efficiencies, it could not possibly do it by just improving
the thermal cycle process; for, even if we made that 99% efficient, the overall
efficiency will be limited to 70% due to flame irreversibility.
It has been known for a long time that combustion efficiency would
be higher if the thermal cycle could operate on higher temperatures of the
products of combustion. Such higher flame temperatures would be easily achieved
by preheating the air intake or using, instead of air, pure oxygen mixed with
recirculated products of combustion. But high temperatures are a serious
challenge to all materials. Thus, an important alternative is to replace the
usual single-step-combustion flame with a sequence of partial oxidation steps,
such as methane reforming, coal gasification, water-gas shift reaction. In the
end, the fuel is oxydized into water and CO2 as usual, of course. But,
sequencing the fuel oxidation into partial steps, involves intermediate
reactants such as carbon monoxide and hydrogen, and allows to integrate the
partial combustion processes with the thermal cycle, thus obtaining a better
control over entropy production by irreversibility.
Along these lines, very nice oxy-fuel combustion technologies are
being developed, with various new integrated cycles mainly developed in
connection with CO2 sequestration for ‘clean coal’ power. The best designs seem
to promise overall exergy efficiencies up to 47%, after full CO2 sequestration,
which is quite remarkable.
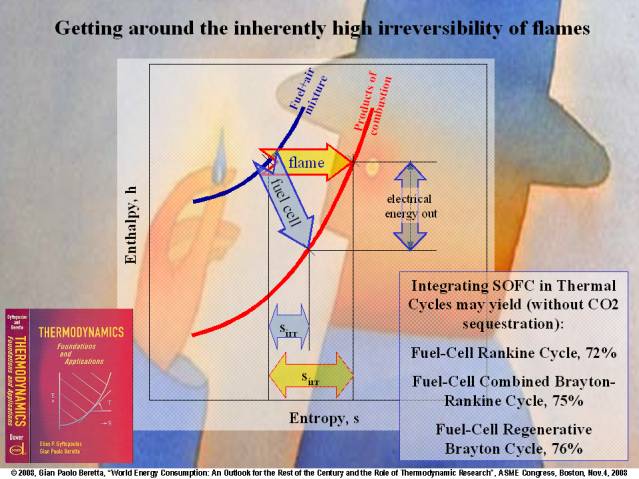
30.
The problem that must be solved to get around the inherently high
irreversibilities of traditional combustion in adiabatic flames, is represented
very schematically in this enthalpy versus entropy diagram. The blue curve
shows the equilibrium states of the fuel-air mixture, the red curve that of the
products of combustion.
In an adiabatic flame, a sequence of unconstrained highly
nonequilibrium states develops rapidly from the blue to the red curve,
horizontally, at constant enthalpy. On the entropy axis we read the entropy
change, which is all due to irreversibility, and it is unavoidable because we
have no control of the nonequilibrium states.
If we could control them, then we could extract work by exploiting
the spontaneous tendency towards the red curve. This is what fuel cells
achieve.
Many schemes have been studied which integrate solid-oxide
high-temperature fuel cells with various combinations of thermal cycles
yielding overall net efficiencies that on paper are as high as 76%. So this route
is very promising, and makes the 80% next goal appear not so far away.
31.
Let me conclude by going back to efficiency and energy prices in
the U.S. The average price of electricity in Massachusetts is 15 cents per kWh,
but the average for the US is 10 cents, while in Europe it is three times as
much. This simple fact is quite indicative of why in Europe, to save on the
energy bill, almost every medium-sized industry has its own cogeneration
facility producing electricity and process steam. In the US, cogeneration is
still very little diffused.
It has been clear since the ‘73 embargo, but was so far ignored,
that the only effective incentive to improve energy efficiency is to higher
energy prices.
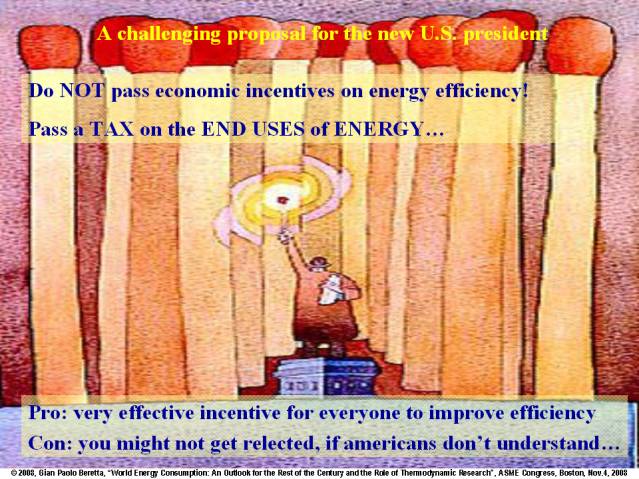
Since by now polls are almost closed today, and so I will not
spoil the elections if I told you what I would do if I were the new president.
I would not pass economic incentives for energy efficiency improvements, but I
would convince americans that they need a heavy federal tax on the end uses of
energy.
I know, americans hate taxes. Who doesn’t? So that’s why I didn’t
talk about this possibility during my campaign. Because I wanted to be elected,
and do something good for my country, which I couldn’t do if I were not
elected… But now that I have been elected, I would tackle the problem the right
way. Passing new economic incentives, not only would increase the already huge
deficit and debt situation, but more importantly could never distribute the
money in a fair way to promote the enormous variety of small and large existing
opportunities for improvement that are out there. As usual with incentives, the
powerful lobbies would take them all, and we would not reach our objective.
Instead, a new long-term federal tax program and the consequent
prospect of a stable high-energy-prices age, will shift uniform large
investments towards high efficiencies in all sectors.
Of course, there might be some political drawbacks, if I cannot
convince americans that this is their best bet. But even if I don’t get
re-elected, I would have done some good to my country.
Anyway, since I couldn’t run for president because I was not born
here, I’ve nothing to loose if I tell you what I would do…
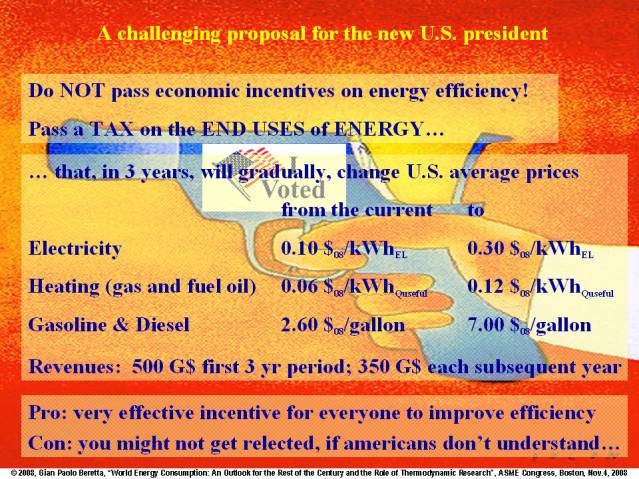
32.
…and please be patient a few more minutes, and you will have your
chance to shoot at me at the end of the talk.
I would pass today a long-term ten-year tax program that in the
first three years gradually takes the average price of electricity, in today’s
dollars, from the current 10 cents to 30 cents; takes the price of natural gas
and fuel oil for residential heating from the current 5-6 cents per kWh of
useful heat to about 12 cents, and takes the price of gasoline from the current
2,5-3 dollars per gallon to about 7 dollars. This is much more than just a
carbon tax, and I would rather call it an ‘energy responsibility’ tax.
A back of the envelope calculation shows that the revenues of the
initial three-year period would be about 500 billion dollars, and from then on
it would be 350 billions each year. So, in addition to guaranteeing a big dent
in energy efficiency throughout the country and, hence, a step towards energy
independence, this energy tax policy will also contribute to fix quickly the
deficit problem, which americans should realize that one way or another will be
solved by reaching to their own pockets anyway!
33.
Well, let me conclude with a recommendation that you might like
more. We need to invest much more money on research, especially open-ended
fundamental research, including of course thermodynamics! But the question is:
who should put the money?
Pharmaceutical companies invest 18% of their revenues in R&D.
Semiconductor firms invest 16%. Energy companies invest less than 0.3% percent.
Why so? I think it has to do with the large inertia of the energy system and
the very long times that new technologies take to penetrate in the energy
market.
So, we cannot expect energy companies to promote and sustain an
energy technology revolution. It is the federal government which must do it,
funding it together with any other fundamental research. In 1980, 10% of the federal research dollars
went to energy. Today, the share is down to 2%. With this pattern of
investment, the U.S. cannot expect to be a leader in development of the 80%
efficient technologies which we forecast for the second half of the century.

34.
With this, I thank the foundation Jean-Michel Folon, for
publishing the evocative works of art that I freely adapted to obtain the
backgrounds of my slides. And I thank you all for your attention, and again for
the kind invitation, and I hope during the reception we will have some lively
discussion about the many entropy challenges I touched upon. Thank you.
Additional Text and Slides on Hydrogen
vs Electric Battery Cars
from the talk entitled A quantitative
(out)look at the future of energy
delivered by Gian Paolo Beretta at MIT on Friday, Jan.11, 2008,
Room 6-120, 9:00-10:30 am, as part of IAP.

35.
I look forward to your comments and to the discussion which I hope
will follow, as I am quite open to hear you comments, and I am eager to learn
from you, if I should change my mind about this too. Therefore, to provoke some
discussion, I will conclude my talk by showing the numbers, that convince me,
that a hydrogen economy centered on hydrogen cars, is a bad idea, both
from the point of view of energy consumption and of climate change. The numbers
I found, from prominent sources, seem to suggest quite clearly that an economy
based on electricity and electric battery cars, is much more energy efficient
and environment friendly.
Of course, hydrogen may be the most abundant element in the
Universe, and there is no doubt that it is a great fuel, if handled with care,
but nowhere on Earth we have hydrogen wells. Hydrogen on Earth is not a primary
source of energy, yet most european laymen, due to bad information, have
unfortunately been convinced that hydrogen, is the source of energy of the
future.
Of course in this room we all know very well that if we want to
produce hydrogen, we must consume a primary resource. Just as we do to produce
electricity.
Electricity is an energy carrier, that we have been using for over
a hundred years, central to past as well as current industrialization
processes. Electricity is a non-polluting energy carrier, in the sense that where
it is used for a variety of end uses, it does not produce local pollution. But
we do pollute, and do consume primary energy, in the power plants where the
electricity is generated.
For hydrogen, the picture is exactly the same. Hydrogen too is a
non-local-polluting energy carrier, if it is used in a fuel-cell to power an
electric car. But to make the hydrogen, we do pollute, and do consume primary
energy.
So, to decide whether to invest on hydrogen or on electricity, we
must study the entire life cycle from well to wheel, and we must compare the
two energy carriers on equal grounds.
36.
Here is such a comparison, in a scenario in which the primary
energy source is natural gas. Forget the details. The problem of an energy life
cycle that passes through the production of hydrogen, is that it generally has
more intermediate processes, and more irreversibilities than going through
electricity. According to these perspective estimates, worked out by
internationally recognized experts, the well-to-wheel efficiency of a hydrogen
car will hardly ever exceed 24%, compared to the 34% of an electric battery
car. This means that in the best perspective, the hydrogen car will consume 43%
more primary energy than the battery car. The local pollution will be zero in
both cases, but mind that if the primary energy source to produce hydrogen or
electricity is a fossil fuel, this also means 43% more greenhouse gases and
other pollutants.

37.
Well. It is often said, that hydrogen is really ideal for use with
renewables, solar photovoltaic and wind power, or with hydro and nuclear power,
and that it helps reducing greenhouse gases in a fully renewable or nuclear
scenario. But this too seems to be contradicted by the conclusions of the
experts. If the hydrogen is produced by electrolysis, using electricity from
renewable sources (or nuclear electricity), the comparison is even worse: 27%
instead of 62%, which means that the consumption of primary energy of the
hydrogen car is 130% more than that of the battery car; it consumes more than
double. And note that these estimates were done on the basis of the same
autonomy, power, and cruise speed of the car.
38.
This table puts the estimates we just mentioned, together with the
many other potential combinations for automotive traction. If we start from the
more likely traditional mix of primary sources, the perspective numbers
proposed by automotive experts, confirm that the electric battery car is the
least consuming, immediately followed by various hybrid car combinations. The
best hydrogen car combination consumes 43% more, as we have seen. If we assume
an unlikely hypothetical scenario of all renewable primary sources, the picture
for hydrogen cars is even worse, as the best combination consumes 130% more, as
we have just seen. This means that for the same mileage, we would need more
than twice as many windmills and twice as many fields covered by photovoltaic
cells.
And notice that these are just the numbers for energy, without
accounting for the additional burden to build up the necessary infrastructures,
the market penetration, and the safety measures that a hydrogen economy would
require.
Sure, the development of electric battery vehicles still requires
a lot of research, and infrastructure investments for upgrading the
distribution network, and also to recharge the exhausted batteries, but a good
part of the technology is well known and established. In addition, based on the
existing electricity network, the diffusion of these vehicles for limited
distances, can start right now and build up gradually. Indeed, some cities in
urban areas where environmental benefits justify the higher costs, have already
adopted fleets of battery vehicles. Research can focus on the development of
better batteries, and more efficient recovery of the kinetic energy dissipated
during braking of the car.

39.
So, all these numbers, show that energy is a complex and global
problem, characterized by large inertia and influenced by geopolitical
difficulties. If we want to change the direction of such a large and heavy
ship, we must schedule and coordinate the maneuver well in advance. Local
manoeuvers, if not well coordinated on the global scale, will hardly be
effective. It is a difficult equilibrium to maintain, between the short-term time
scale of the political world and the long-term time scale needed to direct and
attract investments in the proper coordinated directions.

40.
In the meantime, one of the best investments we can make is in
research, fundamental and applied, technological and scientific, in all
directions, to continue our learning process, and guarantee that indeed sixty
years from now, we will have power plants with a net thermodynamic
effectiveness over 80%, and we will greatly improve on all our end uses of energy.