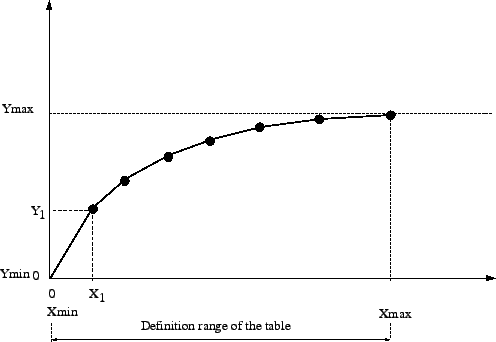
Sometimes a network element is described by its characteristic curve, expressing the reduced mass flow as a function of the pressure ratio (Figure 81). This allows the user to define new elements not already available.
The reduced flow is defined by
 |
(10) |
where ![]() is the mass flow,
is the mass flow, ![]() is the upstream total temperature
and
is the upstream total temperature
and ![]() is the upstream total pressure. The abscissa of the curve is defined
by
is the upstream total pressure. The abscissa of the curve is defined
by
| (11) |
where ![]() is the downstream total pressure. The characteristic curve is
defined
by the following parameters (to be specified in that order on
the line beneath the *FLUID SECTION, TYPE=CHARACTERISTIC card):
is the downstream total pressure. The characteristic curve is
defined
by the following parameters (to be specified in that order on
the line beneath the *FLUID SECTION, TYPE=CHARACTERISTIC card):
Use more cards if more than three pairs are needed. No more than 9 pairs are allowed. In between the data points CalculiX performs an interpolation (solid line in Figure 81). In addition, the default point (0,0) is added as first point of the curve.
The scaling factor (first entry) is used to scale the ordinate values Y.
Example files: characteristic.