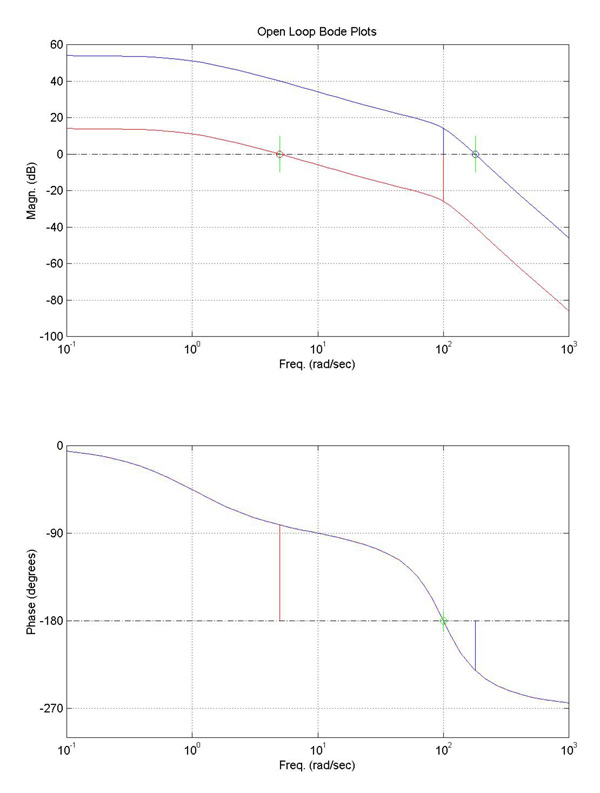
Let's define each, using the figure at right as an aide:
- GAIN MARGIN
- Find the frequency where the PHASE becomes -180 degrees.
--- On our picture, this is at 100 (rad/sec) (marked with a green 'o' on the lower plot).
- Find the GAIN, G (in dB), at this SAME FREQUENCY (from the upper plot).
- Then, we define the GAIN MARGIN as:
(Note that G is in dB here... But you may want to convert between dB and magnitude as a ratio. To covert magnitude, M, to gain in decibels (dB), G, you use G=20*log10(M). To convert G to M, M=10^(G/20))
if you are measuring Magnitude (M) as a ratio (not is dB).
- PHASE MARGIN
- Find the frequency where the GAIN is 0 dB. (This means the output and input amplitudes (magnitudes) are identical at this particular frequency; on the Bode plot, it's where the transfer function crosses 0 dB on the upper [magnitude] plot.)
--- For the red Bode plot, this happens at about 5 (rad/sec) [marked with a red 'o' in the upper plot].
--- For the blue Bode plot, the 0 dB crossover occurs at a frequency of around 181 (rad/sec) and is shown with a blue 'o'.
- Find the PHASE, P (in degrees), at this SAME FREQUENCY (by now looking at the lower plot).
(This particular phase is marked in the lower plot at right for both the red and blue transfer functions with lines of corresponding color...)
- Then, we define the PHASE MARGIN as:
Phase Margin = +P + 180 degrees
|
|