


Section 4.2.3
Bar Graphs
Bar graphs display relationships among data by means of vertical or horizontal bars of different
different lengths. Sometimes a single bar of a set height is used to break down percentages of the
whole, in much the same fashion as a pie graph.
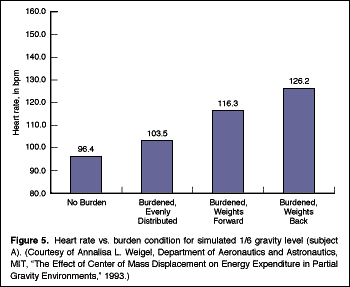
Single Bar Graph
Single bar graphs visualize the effects of varying limiting conditions on one particular object of study,
as in Figure 5, where heart rate is shown under various burden conditions of exercise.
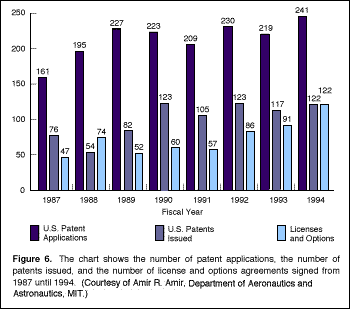
Multiple Bar Graph
Multiple bar graphs visualize the different objects of study under one particular limiting condition,
as in Figure 6, where three items are compared over time.
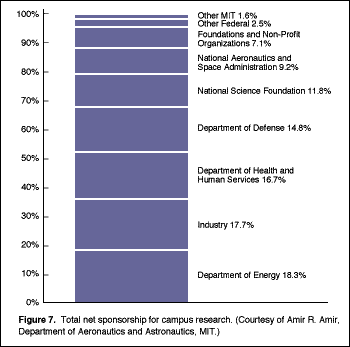
Stacked Bar Graph
Stacked bar graphs visualize various items as percentages of the whole for ease of comparison and
contrast. Figure 7 is a single bar graph showing percentages of one particular object of study.
(Compare this figure with Figure 11, a pie graph drawn from
the same data.) Figure 2 is an example of a multiple stacked
bar graph where various items are broken down into percentages of the whole for comparison.

## Bar Graphs ##

[ Home | Table of Contents
| Writing Timeline | Index |
Help | Credits]