Cores by the Uniform Droplet Spray
Process
by
Jiun-Yu Lai
B.S., Naval Architecture and Ocean Engineering (1993)
National Taiwan University
Submitted to the Department of Mechanical Engineering
in Partial Fulfillment of the Requirements for the Degree of
Master of Science in Mechanical Engineering
at the
Massachusetts Institute of Technology
June 1997
© 1997 Massachusetts Institute of Technology
All Rights Reserved
Signature of Author:
Department of Mechanical Engineering
May 9, 1997
Certified by:
Dr. Jung-Hoon Chun
Edgerton Associate Professor of Mechanical Engineering
Thesis Supervisor
Accepted by:
Dr. Ain A. Sonin
Professor of Mechanical Engineering
Chairman, Department Graduate Committee
A Study of the Fabrication of Thin Lamination Stator
Cores by the Uniform Droplet Spray Process
by
Jiun-Yu Lai
Submitted to the Department of Mechanical Engineering
on May 9, 1997 in Partial Fulfillment of the Requirements for the Degree of
Master of Science in Mechanical Engineering
ABSTRACT
Thin metal laminations are used to minimize the eddy current loss in the stator cores of high-speed, high-performance induction motors. The conventional fabrication technique, however, introduces limitations on the thickness of laminations, the dimensional accuracy of the assembled stator cores, and the production economy. These limitations greatly hamper the application of high-speed induction motors in industry.
In this study, a novel spray-forming technique, the Uniform Droplet Spray (UDS) process, was employed to produce thin laminations. Pure tin was used to study the feasibility of applying the UDS process to fabricate laminations. Based on droplet spray models, this research characterized and optimized the process design parameters, such as droplet thermal state, mass flux distribution, deposit thermal state and substrate motion, to obtain desired lamination geometry and quality. A layer of 127 µm thick lamination was produced by spraying 200 µm droplets. Surface flatness and uniformity of laminations were improved by choosing the proper mass flux distribution and by increasing the degree of deposit overlap between adjacent path segments and between layers. The surface or bulk porosity was reduced by spraying high liquid fraction droplets onto a sufficiently high temperature substrate. An acrylic lacquer was applied between the tin laminations to provide electrical insulation. The insulation properties were evaluated by a standard test method and an equivalent circuit model was presented to analyze the insulation behavior. The results suggest that the effectiveness of insulation depends on the electrical resistivity, thickness and the uniformity of the insulation layers.
Finally, as a proof-of-concept, a five-layer tin
laminate was produced to demonstrate the suitability of the UDS process.
Future work for silicon-iron (Fe-Si) laminations is also suggested.
Thesis Supervisor:
Dr. Jung-Hoon Chun
Esther and Harold E. Edgerton Associate Professor of Mechanical Engineering
Acknowledgments
First, I would like to thank my advisor, Professor Jung-Hoon Chun. His support, guidance and encouragement make this thesis possible. And many thanks to Dr. Nannaji Saka for his valuable comments on my research.
I would also like to thank all of the friends in the Droplet Based Manufacturing Laboratory at MIT. Thank you, Dr. Chen-An Chen for teaching me everything since day one in the lab. Jeanie Cherng, Sukyoung Chey, Ho-Young Kim, and Juan-Carlos Rocha for sharing your experiences and helping me with my experiments. And Dr. Pyongwon Yim, whose wise remarks I cannot forgot.
Thanks to my sponsor, SatCon Technology Corporation, for providing the research funding. Special thanks go to Christopher Brown for his assistance and support on this project.
I would also like to thank Fred Cote who helped me to design most of the apparatus in the laboratory and taught me the art of machining; Yin-Lin Xie and Nil Chatterjee for helping me to prepare metallographic samples and SEM micrographs. Also thanks to Julie Drennan for proofreading this thesis.
My sincere thanks go to my dearest friends, Jung-Chi Liao, Ginger Wang, Bruce Kuo for inspiring and encouraging me during frustration. And Flora Sun for assisting me to prepare the thesis manuscript.
Finally, to my loving parents and sisters who always
believe in me, and my writing skill is not sufficient to express my appreciation
and feeling toward them. Thank you, Mom and Dad, Whuei-Fen, and Whuei-Wen
for your unconditional love and support over years and over the distance.
Table of Contents
|
Page
|
|
| Title Page |
1
|
| Abstract |
2
|
| Acknowledgments |
3
|
| Table of Contents |
4
|
| List of Tables |
6
|
| List of Figures |
7
|
| 1 Introduction |
9
|
| 1.1 Background |
9
|
| 1.1.1 Laminated Stators for High Efficiency Induction Motors |
9
|
| 1.1.2 The Conventional Lamination Fabrication Technique |
10
|
| 1.1.3 The Limitations of Conventional Practice |
11
|
| 1.1.4 The Uniform Droplet Spray Process |
11
|
| 1.2 Objective of Research |
13
|
| 1.3 Overview of the Thesis |
14
|
| 2 The Droplet Spray Models |
15
|
| 2.1 Introduction |
15
|
| 2.2 Jet Break-up |
15
|
| 2.3 Droplet Trajectory Model |
17
|
| 2.4 Droplet Thermal Model |
20
|
| 2.5 Droplet Deposition |
23
|
| 3 Fabrication of Laminations |
26
|
| 3.1 Introduction |
26
|
| 3.2 Process Overviews |
26
|
| 3.2.1 Apparatus Setup |
26
|
| 3.2.2 Material |
28
|
| 3.2.3 Experimental Procedures and Conditions |
28
|
| 3.2.4 Sample Preparation |
29
|
| 3.3 Characteristics of Laminations |
30
|
| 3.3.1 Thickness |
30
|
| 3.3.2 Uniformity |
34
|
| 3.3.3 Porosity |
40
|
| 3.4 Multi-layer Lamination Production |
45
|
| 4 Interlaminar Insulation |
47
|
| 4.1 Introduction |
47
|
| 4.2 Insulation Materials |
48
|
| 4.2.1 Oxide Layer |
48
|
| 4.2.2 C-5 Varnish |
49
|
| 4.2.3 Aramid Fiber Paper |
50
|
| 4.2.4 Acrylic Lacquer |
50
|
| 4.3 Deposition of Insulation Layers |
51
|
| 4.4 Measurement of Insulation Layers |
52
|
| 4.4.1 Standard Procedures |
52
|
| 4.4.2 Results and Discussion |
53
|
| 5 Summary |
58
|
| 5.1 Summary |
58
|
| 5.2 Future Work |
59
|
| Bibliography |
60
|
List of Tables
|
Page
|
||
| Table 2.1 | The spray conditions to illustrate the mass flux distribution on the substrate |
20
|
| Table 3.1 | General spray conditions for tin lamination production by the UDS process |
30
|
| Table 3.2 | Controlled process parameters for the study of porosity formation |
42
|
| Table 4.1 | Results of selection of interlaminar insulation materials |
48
|
| Table 4.2 | Important properties of the Nomex 410 type aramid paper |
50
|
| Table 4.3 | Dimensions of specimens used in insulation measurements |
53
|
List of Figures
|
Page
|
||
| Figure 1.1 | Process flow of conventional lamination fabrication practice |
10
|
| Figure 1.2 | The UDS process for lamination fabrication |
13
|
| Figure 2.1 | Break-up of a laminar jet |
16
|
| Figure 2.2 | Forces balanced on a single droplet |
18
|
| Figure 2.3 | Simulation and experimental results of the mass flux distribution profiles at 600V charging |
20
|
| Figure 2.4 | Simulation results: (a) temperature vs. flight distance; and (b) liquid fraction vs. flight distance |
24
|
| Figure 2.5 | The UDS process control chart |
25
|
| Figure 2.6 | The process-microstructure map for the UDS process |
27
|
| Figure 3.1 | Experimental apparatus for lamination fabrication |
28
|
| Figure 3.2 | Low-temperature droplet generation unit |
33
|
| Figure 3.3 | SEM picture of a tin lamination of 127 µm produced by the UDS process |
35
|
| Figure 3.4 | Deposit cross-section profiles on a moving substrate at 600V and 800V charging |
36
|
| Figure 3.5 | Geometric effect of steep edges on the deposit shapes: (a) with steeper edges, and (b) with smoother edges |
37
|
| Figure 3.6 | Major concerns for path design |
38
|
| Figure 3.7 | Simulation results of the deposit cross-section profile with a track gap of (a) 1/2, and (b) 1/4 spray cone width |
38
|
| Figure 3.8 | SEM picture of the deposit cross-section profile produced with a track gap of (a) 1/2, and (b) 1/4 spray cone width |
39
|
| Figure 3.9 | Two deposition path design concerns: (a) shifting the starting point; and (b) changing the path patterns |
40
|
| Figure 3.10 | SEM picture of a typical porous lamination top surface |
41
|
| Figure 3.11 | SEM pictures to demonstrate effects of droplet liquid fraction, substrate temperature, track gap, and satellites on the formation of porosity |
43 |
| Figure 3.12 | SEM picture to show the porous lamination deposited on a excessive high temperature substrate |
44
|
| Figure 3.13 | SEM picture for a stack of five-layer tin laminations with interlaminar insulation |
46
|
| Figure 4.1 | Schematic diagram of apparatus for insulation measurements |
54
|
| Figure 4.2 | Measurements for two-layer tin lamination specimens |
55
|
| Figure 4.3 | Equivalent circuit of one lamination with a single layer of insulation on its surface |
56
|
| Figure 4.4 | Schematic illustration of the possible positions from which the specimens were cut |
57
|
Chapter 1 Introduction
1.1 Background
1.1.1 Laminated Stators for High Efficiency Induction Motors
Induction motors are both a prime mover and major consumer of electrical energy in our modern industrial society. Improvements to the efficiency of induction motors have reduced energy consumption over the years. Theoretically, efficiency and power density of electric motors increase with their rotating speed. This is because the torque required for generating a given power is lower when motors operate at higher speed. The rotating machinery driven by the motors also becomes more efficient at higher speeds (Brown 1994). For example, the efficiency of turbomachinery increases with rotational speed due to thinner boundary layers at high flow rates. Thus, machine efficiency at high speeds cannot be realized without minimizing energy losses in the motors.
One of the main energy losses for high-speed motors is the core loss
from the eddy current in the stator and rotor cores. The alternating magnetic
flux creates electromotive forces (emfs) inside the material immersed.
These emfs fluctuate at the same speed as the time-varying magnetic flux
and, similarly, create currents normal to the flux path. Because of the
resistance of the core material, energy, instead of generating power, is
dissipated as heat in the cores due to the ![]() loss.
When a motor runs at higher speeds, this eddy current loss becomes more
significant. There are two standard ways to reduce the loss. Firstly, a
core material with high resistivity is used to reduce the induced eddy
current. Although the resistance,
loss.
When a motor runs at higher speeds, this eddy current loss becomes more
significant. There are two standard ways to reduce the loss. Firstly, a
core material with high resistivity is used to reduce the induced eddy
current. Although the resistance, ![]() ,
increases, the eddy current,
,
increases, the eddy current, ![]() ,
decreases quadratically, which reduces the total energy dissipation. This
is why the stator cores for high frequency applications are made of iron
alloyed with 0.5wt% to 3.5wt% silicon. Secondly, cross sections of the
cores can be divided into a number of small areas and insulated from their
neighbors to shorten the conducting paths of eddy currents. Since
,
decreases quadratically, which reduces the total energy dissipation. This
is why the stator cores for high frequency applications are made of iron
alloyed with 0.5wt% to 3.5wt% silicon. Secondly, cross sections of the
cores can be divided into a number of small areas and insulated from their
neighbors to shorten the conducting paths of eddy currents. Since ![]() is
proportional to the conducting path, shorter conducting paths and smaller
eddy currents result in an overall reduction of the core loss.
is
proportional to the conducting path, shorter conducting paths and smaller
eddy currents result in an overall reduction of the core loss.
1.1.2 The Conventional Lamination Fabrication Technique
Figure 1.1 shows the conventional production flow chart for the laminations of induction motors (Brown 1994). This manufacturing process starts with cold-rolling the silicon iron (Fe-Si) to the required thickness for lamination sheets. For high frequency applications, the least core loss can be obtained by using very thin lamination sheets, usually of 0.1-0.17 mm in thickness. An insulation coating is then applied to the lamination sheet to prevent eddy currents from traveling between the sheets. After that, the lamination sheets are shaped by the stamping process in either a progress or a single station die. Then the sheets are stacked on an aligning fixture and pinned or welded together to produce the magnetic cores. Because the stamping process introduces burrs and stress around the edges, some post-machining and heat treating are performed to obtain maximum core performance.
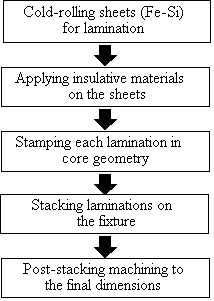
Figure 1.1 Process flow of conventional lamination fabrication practice.
1.1.3 The Limitations of Conventional Practice
The applications of high-speed induction motors are limited by some of the constraints of the current manufacturing practice. The first limitation is thickness. Because excessive rolling increases the brittleness of Fe-Si, the cold-rolling process introduces a lower limit on the available thickness for laminations (about 0.1-mm thick). Another limitation is the dimensional accuracy resulting from both the stamping and stacking operations. The burrs and warps from stamping lead to difficulties in stacking and tolerance control. For a high-speed machine, these inaccuracies sometimes can be 50% or more of the design gap (Brown 1994) and thus have a significant impact on the performance of motors. Furthermore, excessive burrs provide conduction paths between lamination layers, increasing the eddy current loss. Stacking warped laminations leads to gaps between layers which causes volume loss of magnetic material in a core. These factors degrade core efficiency and, therefore, should be eliminated by secondary operations.
When the laminations are needed for a high frequency application, these limitations increase the costs, necessitating the thinner laminations, more exact machining and assembling, and other special fabrication requirements. For example, the selection of lamination thickness is a fairly straightforward trade-off between core loss and fabrication cost. Thinner laminations reduce the core loss. However, thinner material requires more steps of rolling and further stress relief annealing, and more laminations for a given stack height. These factors increase the fabrication cost. Another example is that the stamping process is always replaced by non-traditional machining operations, such as EDM, to meet the tighter design tolerance for high-speed, high power motors. This alternative increases the original intensive tooling cost and requires a large production volume to justify that cost.
1.1.4 The Uniform Droplet Spray Process
To solve these limitation problems in the conventional stator cores fabrication, the Uniform Droplet Spray (UDS) process is proposed as an alternative for producing very thin laminations for high performance motors with controlled geometrical dimensions and material properties. Figure 1.2 schematically illustrates the lamination production concepts. The droplet generation unit generates uniform liquid droplets with a controlled size and thermal state. To prevent merging, the droplets are charged during jet break-up. The charged droplets scatter during flight and finally land on the substrate with a controlled mass flux distribution (Abel 1994). The laminations are then incrementally built up by collecting droplets in the mold. The geometry of the lamination can be determined by the droplet spreading behavior, mass flux distribution on the substrate, and the motion of substrate. The droplet thermal state and controlled substrate temperature determine the solidification conditions and affect the deposit microstructure (Chen 1996).
After spraying a thin layer of Fe-Si on the substrate, a layer of insulation material is applied onto the lamination, and then another lamination is sprayed onto that. With a repetition, a near-net-shape lamination stack is built.
The advantages of using the UDS process to produce laminations are listed as following:
(1) A precise lamination thickness control can be carried out by controlling the droplet size and the deposition rate in the UDS process.
(2) The silicon content of rolled steel is limited because the Fe-Si tend to become more brittle with increasing silicon concentration. However, the UDS process can spray any percentage of Fe-Si alloys to gain optimal properties, and hence reduce core loss.
(3) The lamination fabrication process can be simplified by integrating the insulation application apparatus with the UDS process. The original high production cost can be reduced by the simplification of this process.
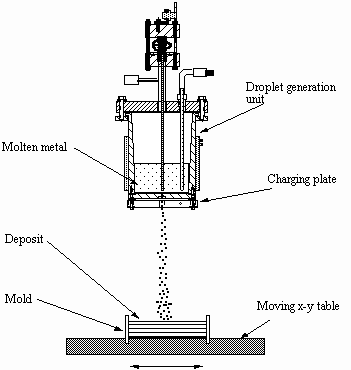
Figure 1.2 Schematic of the UDS process for lamination fabrication.
1.2 Objective of Research
The objective of this research is to study the feasibility of producing laminations by the UDS process. Firstly, the spray-deposition process for lamination is characterized to select the optimum processing conditions. Secondly, a method of applying interlaminar insulation material is developed. Thirdly, the resulting lamination samples are examined to ensure the insulation layers can survive at high deposition temperature in the UDS process and still provide desirable electrical insulation properties.
1.3 Overview of the Thesis
The first chapter describes the background, motivation, and goals
of this thesis. In the next chapter, the basic physical models of the UDS
process as related to the lamination fabrication are described. Chapter
3 presents the experimental methodology used to characterize and optimize
the lamination production. The experimental results of the improvement
are presented and discussed. In Chapter 4, the results of the insulation
material selection are presented. With the proper material, a proof-of-concept
stack of laminations are produced by the UDS process and the electrical
insulation properties of this sample are measured under the ASTM standard
procedures. A summary of the current study and recommendations for future
work are then reported in Chapter 5.
Chapter 2 The Droplet Spray Models
2.1 Introduction
In the UDS process, the deposit geometry and microstructure are controlled by such independent parameters as orifice size, crucible temperature, perturbation frequency, charging, substrate temperature, and substrate speed. These parameters determine the dependent design parameters, such as droplet thermal state, deposit thermal state, droplet spreading, and mass flux distribution. They, therefore, affect the properties of the final deposit. Much effort has been spent in exploring the relationships between these parameters and design parameters (Passow 1992, Abel 1994, Acquaviva 1995, Chen 1996, Yim 1996). Several established models of the UDS process will be described in this chapter to determine the desired droplet size, droplet liquid fraction, and mass flux distribution at impact on the substrate.
2.2 Jet Break-up
The droplet size produced by the UDS process can be predicted by the capillary instability of the molten metal jet. As in Figure 2.1, when a pressure difference is applied to the melt in the crucible, a liquid jet is ejected from the orifice at the bottom of crucible. Due to capillary instability, the jet will break up into a train of droplets. If the proper frequency is applied in the melt near the orifice, the break-up becomes stable and produces uniform size droplets. Rayleigh (1878) developed a linear stability analysis of the inviscid laminar jet finding the dimensionless wavelength, l/dj, corresponding to the maximum growth rate factor to be:
![]() (2.1)
(2.1)
where l is the wavelength of perturbation according to the maximum growth rate factor and dj is the jet diameter. The growth rate factor determines how fast a stream can be broken into a train of droplets (Yim 1996). In practice, l determines the driven perturbation frequency to obtain uniform break-up. The droplet size can be determined using Equation (2.1) and the mass conservation principle. The droplet volume can be predicted by calculating the cylinder volume of jet enveloped in one wavelength. If constant density and spherical shape are assumed, the droplet diameter, dd, can be determined by the following expression:
 (2.2)
(2.2)
Substituting Equation (2.1) into Equation (2.2), we can find a relation between droplet diameter and the jet diameter:
![]() (2.3)
(2.3)
Thus the droplet diameter is approximately twice of the jet diameter.
In practice, however, the jet break-up is highly nonlinear. Rayleigh's analysis cannot explain nonlinear behaviors, such as the formation of satellites, during break-up. Satellites sometimes cause a serious problem for the UDS process. Since the satellites are usually smaller than the normal uniform droplets, they solidify and scatter faster and thus affect the deposit structure and the mass flux distribution in spray (Yim 1996). Fortunately, satellites can be eliminated by applying the appropriate frequency (Passow 1992) or by increasing the amplitude of perturbation (Shutts 1995).
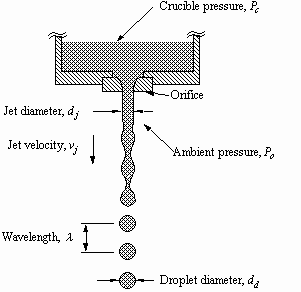
Figure 2.1 Schematic diagram of the break-up of a laminar jet.
2.3 Droplet Trajectory Model
In the UDS process, the droplets are charged to prevent merging. Due to the Coulomb forces, charged droplets scatter as they travel and cause a nonuniform droplet (mass) distribution on the collecting substrate. To study the effect of mass flux distribution on the geometry of the deposit, the dynamic behavior of droplets in flight should be understood. By applying Newton's second law of motion, droplet velocity and trajectory can be predicted by balancing the force acting on a single droplet, i.e., gravity force, drag force, and Coulomb repulsion force. The equation of motion can be written as:
![]() (2.4)
(2.4)
where ![]() is the mass
of each uniform droplet, vd
the velocity of the droplet,
is the mass
of each uniform droplet, vd
the velocity of the droplet, ![]() the
gravity force,
the
gravity force, ![]() the drag
force,
the drag
force, ![]() the total Coulomb
force. Figure 2.2 schematically shows these forces acting on a droplet.
the total Coulomb
force. Figure 2.2 schematically shows these forces acting on a droplet.
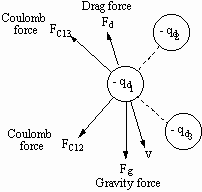
Figure 2.2 Schematic illustration of forces balanced on a single droplet.
The gravity force is the product of droplet mass and the gravity constant, g, and is given by:
![]() (2.5)
(2.5)
where ![]() is the unit
vector in the vertical direction.
is the unit
vector in the vertical direction.
The total Coulomb repulsion force on a droplet is given by the summation of all the Coulomb forces imposed by its neighboring droplets:
![]() (2.6)
(2.6)
where eo is the permittivity of free space, N the total number of droplets in flight, qd the
electrical charge carried by each droplet, and rj the distance between the droplet and droplet j.
In general, the drag force is expressed as:
![]() (2.7)
(2.7)
where ![]() is
the coefficient of drag, rm
the density of metal, and vd
the velocity of the droplet. In the UDS process, the droplets are aligned
in a stream before scattering. The effect of droplet alignment on the drag
coefficient must be taken into account and distinguished from the instance
in which the droplets have been sufficiently scattered from the centerline.
Mulholland et al. (1988) developed a correlation for the drag coefficient
of aligned droplets in the stream. Passow (1992) and Abel (1994) incorporated
this correlation and the above argument to develop the droplet trajectory
model for the UDS process. A fourth-order Runga-Kutta numerical integration
scheme has been used to solve the droplet velocity and trajectory. The
simulation velocity was verified by experiments using 200 µm tin
droplets, showing a good agreement (Kim 1996).
is
the coefficient of drag, rm
the density of metal, and vd
the velocity of the droplet. In the UDS process, the droplets are aligned
in a stream before scattering. The effect of droplet alignment on the drag
coefficient must be taken into account and distinguished from the instance
in which the droplets have been sufficiently scattered from the centerline.
Mulholland et al. (1988) developed a correlation for the drag coefficient
of aligned droplets in the stream. Passow (1992) and Abel (1994) incorporated
this correlation and the above argument to develop the droplet trajectory
model for the UDS process. A fourth-order Runga-Kutta numerical integration
scheme has been used to solve the droplet velocity and trajectory. The
simulation velocity was verified by experiments using 200 µm tin
droplets, showing a good agreement (Kim 1996).
In this thesis, the droplet trajectory is used as input to study the effect on the mass flux distribution and therefore the deposit geometry. Abel (1994) generated a simulation code to predict the mass flux distribution for the UDS process on either a stationary or a moving substrate. Figure 2.3 shows both experimental and simulated results of mass flux distribution profiles on a moving substrate. In this figure, the droplet charging voltage is 600V. Other spray conditions are listed in Table 2.1. The solid line represents the simulated cross-section profile of deposit and the dash line represents the experimental result. The spray cone width, the maximum horizontal distance between any two droplets in a spray at a given flight distance, can be estimated by measuring the deposit width. It is about 2.05 cm, in this case, by simulation and 2.2 cm by experiment. Basically, these two profiles are similar. The discrepancy near the peaks of the deposit can be explained by the local flow of the liquid splats on the deposit surface which smoothes the peaks in experiments. The spray cone width as well as the profile determine the deposit uniformity and are discussed in detail in the next chapter.
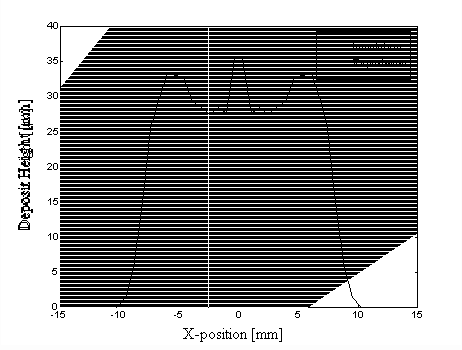
Figure 2.3 Simulation and experimental results of the mass flux distribution profiles on a moving substrate at 600V charging.
Table 2.1 The spray conditions to illustrate the mass flux distribution
on the substrate.
|
|
|
|
|
|
|
|
|
|
|
|
|
|
2.4 Droplet Thermal Model
The temperature history and the liquid fraction of the droplet can be predicted by modeling its heat loss to the surrounding gas through convection and radiation. Based on the energy balance, the enthalpy loss of the droplet can be given by:
![]() (2.8)
(2.8)
where H is the enthalpy of the droplet per unit of mass, h
the convection heat transfer coefficient, ![]() the
surface area of the droplet, s the
Stefan-Boltzman constant, e
the emissivity, Td the droplet temperature,
and Tg the gas temperature. The radiation term
for low melting point metals, such as tin, zinc, and their alloys, can
be neglected since its order of magnitude is less than the convection term,
but it is not negligible for higher melting point metals or alloys, such
as Fe-Si. A Newtonian cooling assumption can be applied when the Biot number
of the droplets is less than 0.1, as is the case with both 200 µm
tin and Fe-Si droplets. Therefore, the temperature can be considered as
uniform spatially in the droplets.
the
surface area of the droplet, s the
Stefan-Boltzman constant, e
the emissivity, Td the droplet temperature,
and Tg the gas temperature. The radiation term
for low melting point metals, such as tin, zinc, and their alloys, can
be neglected since its order of magnitude is less than the convection term,
but it is not negligible for higher melting point metals or alloys, such
as Fe-Si. A Newtonian cooling assumption can be applied when the Biot number
of the droplets is less than 0.1, as is the case with both 200 µm
tin and Fe-Si droplets. Therefore, the temperature can be considered as
uniform spatially in the droplets.
The convection heat transfer coefficient is given by the Ranz-Marshall correlation:
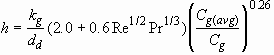 (2.9)
(2.9)
where kg is the gas thermal
conductivity, Re=rgvddd/mg
the Reynolds number of flow over a sphere, Pr=mgCg/kg
the Prandtl number, ![]() the
heat capacity of gas at the gas temperature, and
the
heat capacity of gas at the gas temperature, and ![]() the
heat capacity of the gas at the average of the gas and droplet temperature.
To take account of the droplet alignment, the heat transfer coefficient
must be adjusted by the ratio of the drag coefficient for a line of droplets
to the drag coefficient for a isolated droplet, as mentioned in Section
2.3 (Passow 1992). From Equation (2.8) and Equation (2.9), the rate of
enthalpy loss can be calculated at any given droplet temperature.
the
heat capacity of the gas at the average of the gas and droplet temperature.
To take account of the droplet alignment, the heat transfer coefficient
must be adjusted by the ratio of the drag coefficient for a line of droplets
to the drag coefficient for a isolated droplet, as mentioned in Section
2.3 (Passow 1992). From Equation (2.8) and Equation (2.9), the rate of
enthalpy loss can be calculated at any given droplet temperature.
For pure metal, like tin, enthalpy per unit mass can be determined by considering the heat capacity and latent heat of the metal. The droplet thermal state in terms of enthalpy can be expressed as:
![]() (2.10)
(2.10)
where ![]() is
the specific heat,
is
the specific heat, ![]() the
latent heat, and
the
latent heat, and ![]() the droplet
liquid fraction (with the assumption that no undercooling occurs). According
to the temperature of droplets, the appropriate specific heat is used:
the droplet
liquid fraction (with the assumption that no undercooling occurs). According
to the temperature of droplets, the appropriate specific heat is used:
![]() ,
, ![]() (2.11a)
(2.11a)
![]() ,
, ![]() (2.11b)
(2.11b)
![]() ,
, ![]() (2.11c)
(2.11c)
where ![]() is
the melting point of pure metal (tin's is 232
is
the melting point of pure metal (tin's is 232![]() ),
), ![]() and
and ![]() the
specific heat of liquid and solid metal respectively. The more complex
enthalpy calculation for the binary alloys , such as Fe-Si, can be found
in Chen's thesis (1996).
the
specific heat of liquid and solid metal respectively. The more complex
enthalpy calculation for the binary alloys , such as Fe-Si, can be found
in Chen's thesis (1996).
From Equations (2.10) to (2.11), the enthalpy of pure metal can be expressed as function of temperature when the droplet is fully liquid (x=1) or fully solid (x=0); otherwise it can be expressed as a function of liquid fraction when the droplet is experiencing phase change. Consequently, Equation (2.9) can be solved for the temperature and liquid fraction of the droplet.
Because the droplet velocity and position are prerequisites
for determining the heat transfer coefficient in Equation (2.9), the droplet
trajectory is computed simultaneously with the droplet thermal model. On
this basis, a MATLAB program was written to predict the droplet thermal
states in flight (Chen 1996). Figure 2.4 (a) and (b) respectively show
the simulation results of droplet temperature and liquid fraction with
varying flight distance with the crucible temperature at 340![]() and the same other spray conditions listed in Table 2.1. Chen (1996) and
Cherng (1997) verified the droplet thermal model by spraying Zn-20wt%Sn,
Al-4.5wt%Cu, and Al-4.3wt%Fe alloys.
and the same other spray conditions listed in Table 2.1. Chen (1996) and
Cherng (1997) verified the droplet thermal model by spraying Zn-20wt%Sn,
Al-4.5wt%Cu, and Al-4.3wt%Fe alloys.
2.5 Droplet Deposition
The geometry and microstructure of the deposit produced by the UDS process are controlled by three key design parameters: (1) the droplet thermal state; (2) the mass flux distribution onto the substrate; and (3) the deposit thermal state (Acquaviva 1995). These three parameters are dependent. For example, the deposit thermal state highly depends on spray conditions which are predicted by the droplet trajectory and droplet thermal state models. The relationships among the uncoupled controllable process parameters, these design parameters, and the properties of the final deposit are illustrated by the process control chart shown in Figure 2.5. The models between the controllable process parameters and the design parameters has been described. However, the models between the design parameters and process output properties are still under exploration. Based on experimental results, Chen (1996) developed a process-microstructure map to qualitatively relate the expected microstructure for the UDS process to the droplet thermal state and deposit thermal state. This map is shown in Figure 2.6 and can be used to obtain porosity-free laminations. In this figure, a dense structure can be made by depositing high liquid fraction droplets on a high temperature substrate.
In the following chapters of this thesis, an experimental methodology will study the effects of those design parameters on the deposit properties, especially focusing on the properties of thin laminations produced by the UDS process.
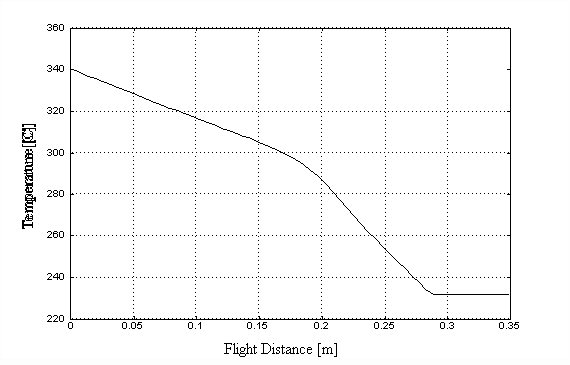
(a)
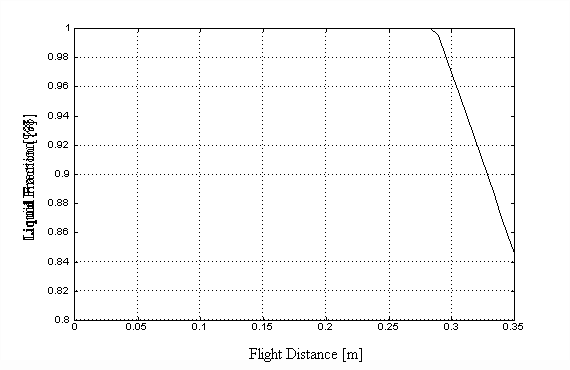
(b)
Figure 2.4 Simulation results: (a) temperature vs. flight distance; and (b) liquid fraction vs. flight distance.
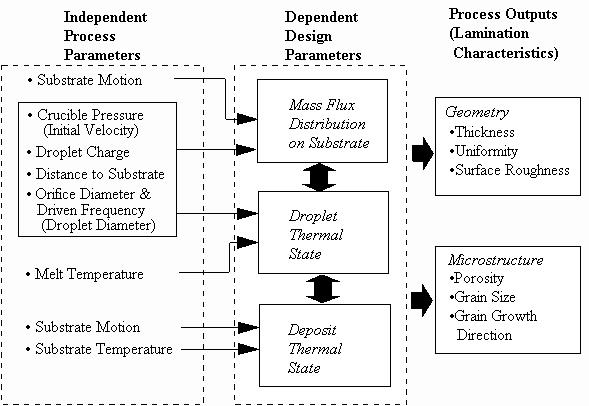
Figure 2.5 The UDS process control chart.

Figure 2.6 The process-microstructure map for the UDS process.
Chapter 3 Fabrication of Laminations
3.1 Introduction
Laminations as stator cores reduce induced eddy current loss and hence increase the performance of motors. To gain the most from laminated stator cores, the laminations must be as thin as possible. However, conventional lamination fabrication technology introduces a limitation on the available lamination thickness. In contrast, the UDS process does not set a thickness limitation in producing laminations.
The UDS process must be characterized before it fabricates laminations. As mentioned in Chapter 2, models with decoupled parameters have been established to allow precise control of the size, thermal state, and trajectory of droplets. The current focus is to relate these models to the characteristics of laminations, such as thickness, uniformity, porosity, and surface roughness. Once the relations are established, process parameters can then be optimized. In the following sections, an experimental methodology for process characterization and optimization is demonstrated. Note that the current apparatus does not operate at high temperatures; therefore, pure tin, instead of Fe-Si, is used to demonstrate the lamination fabrication by the UDS process.
3.2 Process Overview
3.2.1 Apparatus Setup
The experimental apparatus shown in Figure 3.1 comprises of a droplet generation unit, an inert gas chamber, a computer-controlled X-Y stage, and a temperature-controlled copper substrate.
Figure 3.2 shows the schematic of a low-temperature droplet generation
unit which can spray low-melting-point (less than 500![]() )
materials such as zinc, tin, lead, and their alloys. The metal is first
melted in the stainless crucible heated by a bend heater. A stainless steel
mesh screen is placed at the bottom of the crucible to filter the melt
to prevent clogging in the orifice. By pressurizing the crucible with inert
gas, the melt is ejected through the orifice to form a laminar jet.
)
materials such as zinc, tin, lead, and their alloys. The metal is first
melted in the stainless crucible heated by a bend heater. A stainless steel
mesh screen is placed at the bottom of the crucible to filter the melt
to prevent clogging in the orifice. By pressurizing the crucible with inert
gas, the melt is ejected through the orifice to form a laminar jet.

Figure 3.1 Schematic diagram of the experimental apparatus for lamination fabrication.
The inert gas chamber includes a stainless steel chamber (2.0 m x 1.0 m x 0.6 m), a vacuum pump (Welch #1398), a inert gas supply tank, and an oxygen analyzer (Illinois Instrument #2550). The oxygen analyzer monitors the oxygen content during experiments. The motion system contained in the chamber consists of an X-Y stage (Thomson #2EB) driven by two half-step DC motors (VEXTA #PH268M-E1.5B). These two motors hook up with a programmable power amplifier/interface unit (nuLogic unDRIVE).
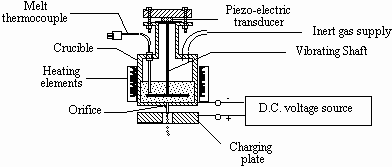
Figure 3.2 Schematic diagram of the low-temperature droplet generation unit.
The temperature-controlled copper substrate (12.7 cm x 12.7 cm) is attached to the linear stage and thermally insulated on the sides and bottom to prevent heat loss. Two cartridge heaters (OMEGA #CIR-1052/120) equally spaced are mounted in the copper substrate. The temperature of the substrate is controlled by two K-type thermocouples (OMEGA #WTK-6-S-12) mounted on the substrate surface and two solid-state temperature controllers (OMEGA #CN9500) installed outside the chamber.
3.2.2 Material
The most common material used for stator core laminations for high performance and high frequency applications is Fe-Si. However, because the droplet generation unit used for the current study is limited to low-melting point metals, pure (99.85%) tin was used to characterize the lamination fabrication process.
3.2.3 Experimental Procedures and Conditions
For each lamination, about 200 grams of material were placed in the crucible with a stainless steel screen of 40 µm mesh and a 100 µm diameter orifice at the bottom. Each experiment begins with evacuating the chamber to 300 millitorr and then backfilling with pure nitrogen to the gauge pressure of 35 kPa (5 psi). This process is repeated twice more to reduce the oxygen level to less than 20 ppm. Control of oxygen content is important for molten jet break-up because a higher oxygen level produces a wandering jet or, in the worst case, retards jet break-up (Yim 1996).
Once the oxygen reading stabilizes, the crucible is heated to melt the material inside. Usually the tin in the crucible is superheated to control the degree of droplet liquid content at any desired flight distance. When the melt temperature stabilizes, the crucible is pressurized to 241 kPa (35 psi) to maintain a constant initial jet velocity of 5.9 m/s. By adjusting the perturbation frequency and amplitude, this laminar melt jet exits through the orifice to break up into uniform droplets. The applied frequency is maintained consistently around 11.6 kHz to produce constant droplet sizes through sets of experiments. At the same time as the jet break-up, the formed droplets are charged and scattered during flight. As mentioned in Chapter 2, the charging voltage affects the mass flux distribution on the substrate and thus plays an important role in determining the geometry of the laminations deposited. Finally, the droplets impinge on the moving substrate and incrementally build up the laminations. A disposable steel sheet is placed on the copper substrate surface to allow easy removal of the laminations from the substrate. The deposits are easy to remove due to the difference of the thermal expansion coefficient between tin and steel. The distance between the orifice and substrate is maintained at 0.35 m. The temperature, the speed, and the moving patterns of the substrate, combined with the droplet liquid fraction and mass flux distribution, are critical in determining the geometry and final properties of the laminations. The effects of those design parameters will be addressed in detail in later sections. The general experimental conditions are listed in Table 3.1.
3.2.4 Sample Preparation
For characterizing a single lamination, three square slices with
approximately same surface areas were randomly selected and cut randomly
from each deposit. One slice was mounted in a clear-cast epoxy, ground
and polished to show the transverse cross-section profile and the consolidation
of deposits. The other two slices were cleaned with methanol and attached
on a piece of test glass by electrical conductive tape for examination
of surface morphology and defects. All samples were observed and measured
under a scanning electron microscope (SEM).
Table 3.1 General spray conditions for tin lamination production
by the UDS process.
| Material | Pure Tin | Chamber Atmosphere | |
| Orifice Size | 100 µm | Pressure Difference | 206 kPa (30 psi) |
| Charging Voltage | 500 - 800 V | Perturbation Frequency | 11 - 14 kHz |
| Crucible Temperature | 300 - 360 |
Substrate Temperature | 160 -210 |
| Flight Distance | 0.35 m | Substrate Speed | 3 - 15 cm/s |
3.3 Characteristics of Laminations
3.3.1 Thickness
The thickness achievable with the UDS process is mainly determined
by the thickness of a single "splat". A splat is a single droplet in contact
with the substrate. In the ideal case, i.e., uniform mass flux distribution
and good spreading of the droplets on the substrate, the minimum thickness
is about one splat thick. The thickness of one splat decreases with the
increase of degree of droplet spreading. Chen (1996) indicated that the
degree of droplet spreading increases with the droplet liquid fraction
and substrate temperature. The droplet spreads out more when it contains
more liquid and solidifies at a slower rate on a high temperature substrate
surface. Kim's experimental results (1996) also indicated that the solidification
time is much longer than the spreading time when a high liquid fraction
droplet is sprayed onto a sufficiently high temperature substrate surface.
In practice, the solidification time scale and spreading time scale are
compared to determine the spray conditions for a longer solidification
time, and thus a higher degree of droplet spreading. The solidification
time scale, ![]() , follows (Gao
and Sonin 1994):
, follows (Gao
and Sonin 1994):
![]() (3.1)
(3.1)
where r is the radius of a droplet, ![]() thermal
diffusivity of the spread material, and
thermal
diffusivity of the spread material, and ![]() the
temperature ratio, which is defined as:
the
temperature ratio, which is defined as:
![]() (3.2)
(3.2)
where ![]() is the droplet
temperature,
is the droplet
temperature, ![]() the freezing
temperature, and
the freezing
temperature, and ![]() the substrate
temperature. The Stefan number , S, is defined as:
the substrate
temperature. The Stefan number , S, is defined as:
![]() (3.3)
(3.3)
where ![]() is specific
heat and
is specific
heat and ![]() latent heat of
droplet.
latent heat of
droplet.
The spreading time is estimated by calculating the time required to reach 90% completion of spreading. Trapaga and Szekely (1991) gave a relation between spreading time and Reynolds number:
![]() (3.4)
(3.4)
where ![]() is the droplet
diameter and
is the droplet
diameter and ![]() is the droplet
impact velocity. The Reynolds number,
is the droplet
impact velocity. The Reynolds number, ![]() ,
is defined as:
,
is defined as:
![]() (3.5)
(3.5)
where ![]() and
and ![]() are
the density and viscosity of liquid metal, respectively.
are
the density and viscosity of liquid metal, respectively.
Kim sprayed 350 µm fully liquid droplets onto a room-temperature surface. The solidification time scale was one order of magnitude longer than the measured spreading time. Compared to Kim's experiments, the substrate temperature in the current study is higher than room temperature. It is expected that the droplet should take a longer time to solidify.
It has also been noted by experimental observation that the average
splat thickness is 1/3 to 1/4 of the droplet diameter when droplets with
0.8 or higher liquid fraction are sprayed on a substrate surface at 180![]() or higher temperature. As described in Chapter 2, the droplet diameter
is typically about twice of the orifice size. For a 100 µm orifice
combined with the above spray conditions, the splat thickness is about
50 µm by estimation, which is close to the experimental observation.
So the theoretical achievable thickness is also around 50 µm. However,
in practice, the achievable thickness for a single lamination is larger
than this value due to the nonuniform mass distribution. Therefore, the
achievable thickness,
or higher temperature. As described in Chapter 2, the droplet diameter
is typically about twice of the orifice size. For a 100 µm orifice
combined with the above spray conditions, the splat thickness is about
50 µm by estimation, which is close to the experimental observation.
So the theoretical achievable thickness is also around 50 µm. However,
in practice, the achievable thickness for a single lamination is larger
than this value due to the nonuniform mass distribution. Therefore, the
achievable thickness, ![]() ,
can be estimated as:
,
can be estimated as:
![]() (3.6)
(3.6)
where ![]() is a deposition
factor which is larger than unity and determined by experiments. For a
100 µm orifice with the other spray conditions listed in Table 3.1,
the deposition factor ranges from 2 to 3, with an achievable thickness
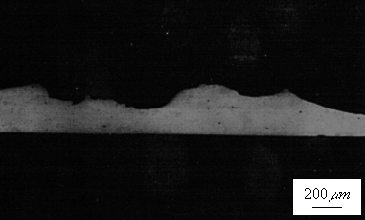
of around 100 µm to 150 µm. Figure 3.3 shows a cross-section
profile of a single laminate produced by the UDS process with average thickness
of 127 µm.
is a deposition
factor which is larger than unity and determined by experiments. For a
100 µm orifice with the other spray conditions listed in Table 3.1,
the deposition factor ranges from 2 to 3, with an achievable thickness
of around 100 µm to 150 µm. Figure 3.3 shows a cross-section
profile of a single laminate produced by the UDS process with average thickness
of 127 µm.
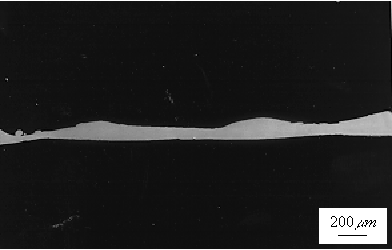
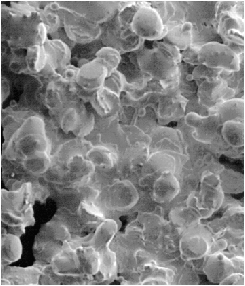
Figure 3.3 SEM picture of a tin lamination produced by the UDS process with average thickness of 127 µm.
This achievable thickness sets a lower bound to the design thickness, ![]() ,
which can be expressed as:
,
which can be expressed as:
![]() (3.7)
(3.7)
where the design thickness is defined as:
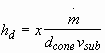 (3.8)
(3.8)
where ![]() is the mass
flux through the orifice and can be measured in experiments,
is the mass
flux through the orifice and can be measured in experiments, ![]() the
spray cone width which can be estimated by the simulation program mentioned
in Section 2.3,
the
spray cone width which can be estimated by the simulation program mentioned
in Section 2.3, ![]() is the
velocity of substrate in the prime motion direction, and
is the
velocity of substrate in the prime motion direction, and ![]() is
the degree of overlap between adjacent parallel deposition segments, which
is defined as the ratio of designed track gap to spray cone width. More
details about the overlap control are found in the next section. Usually
the maximum mass flux and spray cone width are determined first for a more
uniform mass flux distribution profile. The degree of overlap is decided
experimentally. Thus the substrate moving speed can be approximately calculated
by plugging Equation (3.8) with the designed thickness satisfying the criterion
into Equation (3.7). In practice, a few trials are needed to match the
design thickness and actual thickness.
is
the degree of overlap between adjacent parallel deposition segments, which
is defined as the ratio of designed track gap to spray cone width. More
details about the overlap control are found in the next section. Usually
the maximum mass flux and spray cone width are determined first for a more
uniform mass flux distribution profile. The degree of overlap is decided
experimentally. Thus the substrate moving speed can be approximately calculated
by plugging Equation (3.8) with the designed thickness satisfying the criterion
into Equation (3.7). In practice, a few trials are needed to match the
design thickness and actual thickness.
3.3.2 Uniformity
One of the challenges of producing flat laminations by the UDS process is the mass flux distribution on the deposition substrate. The mass flux distribution greatly affects the uniformity and surface morphology of deposited laminations. Poor uniformity of the deposited layers also causes difficulty in applying a uniform insulation coating on the surface. Furthermore, the small unevenness in each lamination can accumulate to form a wavy surface after many laminations are deposited. Such wavy surfaces require additional post-machining operations and may degrade the performance of stator cores.
Some effort to spray thin, flat layers using a robust thermal spray system has been made by Fasching et al. (1993). Their research focused on the Gaussian distribution profile of deposited material from conventional thermal spray sources, such as electrical arcs or plasma torches. However, the nonuniform droplets and coupling of process parameters associated with those techniques make process control difficult. And due to the imperfect mass-flow control, gas turbulence, and torch geometry, the actual spray distribution will usually deviate asymmetrically from the ideal Gaussian distribution and reduce the deposit uniformity (Fasching et al. 1993).
The UDS process was developed for precise process control. It can alter droplet distribution easily by changing the droplet charging. The mass flux distribution can be estimated by the droplet trajectory model presented in Chapter 2. Figure 3.4 shows two simulated distribution profiles on a moving substrate at droplet charging voltage 600V and 800V respectively. The flight distances for both cases are fixed at 0.35 m. Notice that the profiles change symmetrically with the varying charging voltage.
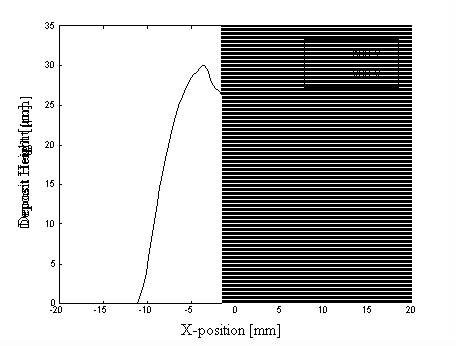
Figure 3.4 Deposit cross-section profiles on a moving substrate at 600V and 800V
charging.
The uniformity and flatness of deposited layers can be improved by selecting the proper spray distribution profile and the appropriate deposition path. For distribution profile selection, the criteria are a uniformly distributed profile and smooth edges. One of the typical mass flux distribution profiles for the UDS process is a saddle, as shown in Figure 3.4. A much flatter profile can be obtained by changing the charging and initial jet speed through the orifice. The profiles with two peaks far away are not desirable since using them would make the deposition path design more complex. Steep edges must be avoided for a smooth deposit overlap between adjacent deposition path segments. Figure 3.5 schematically shows the geometric effect of steep edges on the deposit. The droplet charging corresponding to the selected profile and the other general spray conditions described previously is 600V. The dash line in Figure 3.4 represents this profile measured by experimental results. Based on the optimized distributions, the next step is to determine the best deposition path.

(a) (b)
Figure 3.5 Schematic illustration of the geometric effect of steep edges on the deposit shapes: (a) a profile with steeper edges, and (b) a profile with smoother edges. The schematics show that the steeper edges produce a higher peak near the overlap portion of the two adjacent deposition path segments.
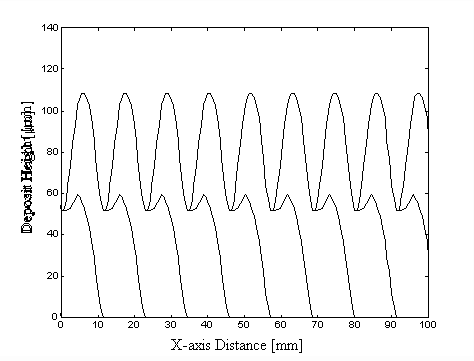
As shown in Figure 3.6, the deposition path is created by moving the substrate along parallel lines in the x and y directions. According to the path defined in this figure, the y direction is defined as the prime direction of deposition. The three important concerns for path design are starting point, track gap, and path pattern. To spray thin laminations by the UDS process, the track gap, defined as the distance between the adjacent parallel deposition path segments, is more critical than the other two concerns in determining deposition uniformity and flatness. Figures 3.7 (a) and (b) show the first layer of deposit as a function of track gap. These simulations are based on the distribution directly from the experimental result of 600V charging and the assumption of
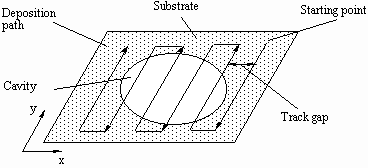
Figure 3.6 Schematic diagram of the major concerns for path design.
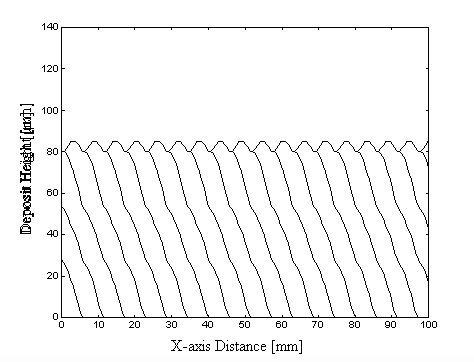
no local mobility for the splats before they fully solidify on the deposition surface. The first example was sprayed with a track gap of 1/2 spray cone width. The solid lines represent the cross-section profiles of deposit on each adjacent path segment. This trajectory produces an uneven layer of deposit with surface waviness of 68 µm, about one half of the maximum deposit height. In comparison, when the track gap is specified as 1/4 of spray cone width, a clear improvement can be seen, with surface waviness of about 5 µm, less than 8% of the prior case. Notice that the substrate speed was reduced to half when the track gap was changed from 1/2 to 1/4 of spray cone width to maintain the same deposit thickness. In real conditions, because the liquid splats can locally move to partial fill valleys, the surfaces would be more flat and uniform than the simulation results. Figures 3.8 (a) and (b) are SEM pictures illustrating the cross section profiles of these two cases. The experimental results strongly agree with the simulation printouts. The surface with a track gap of 1/4 of spray cone width is even smoother than it is in simulation. Theoretically, the best uniformity of deposit can be achieved by decreasing the track gap approach to zero. However, the deposited laminations then become much thicker and are not suitable for core design.
(a)
(b)
Figure 3.7 Simulation result of the first-layered
deposit cross-section profile with a track gap of (a) 1/2 spray cone width;
and (b) 1/4 spray cone width.
(a)
(b)
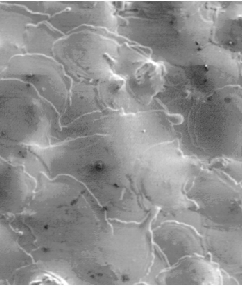
Figure 3.8 SEM picture of the deposit cross-section profile produced with a track gap of (a) 1/2 spray cone width; and (b) 1/4 spray cone width.
Each laminate is usually built up by spraying more than one layer of material. To change the starting point laterally is to change the portion of overlap between layers. Figure 3.9 (a) illustrates the deposition of the peaks of the second layer on the valleys of the previous solidified surface. The final deposit thus will be more uniform and flat. Some improvement of uniformity in general can be observed experimentally by choosing different path patterns for different deposition layers, such as the patterns shown in Figure 3.9 (b). Changing the pattern may change the overlapped portion between layers. Thus the peaks and valleys of each layer may stack together and result in a more even and uniform deposit.
Generally speaking, the starting point and path patterns have minor effects on the uniformity and flatness of deposited laminations; usually, choosing a smaller track gap is enough for any desired improvement.
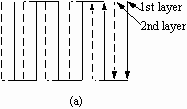
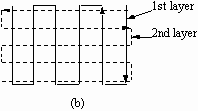
Figure 3.9 Schematic illustrations of two different deposition path design concerns: (a) shifting the starting point; and (b) changing the path patterns.
3.3.3 Porosity
Porosity is a common problem for all spray-formed products. For lamination fabrication, porosity decreases the volume of magnetic material in stator cores and thus degrades the performance of the induction motors. In extreme cases, porosity will cause stress concentration and result in the failure of motors due to the fracture of stator structures. Therefore, porosity should be effectively reduced or, if possible, eliminated.
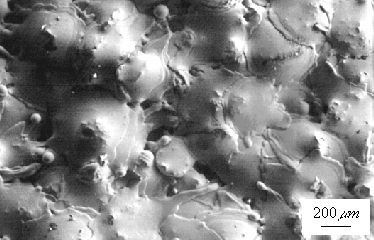
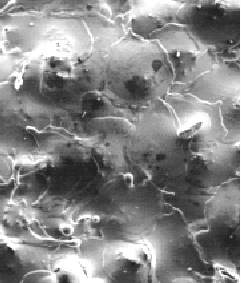
Figure 3.10 SEM picture of a typical porous lamination top surface.
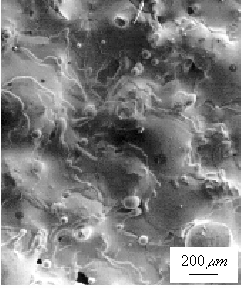
Porosity formation in the UDS process can be attributed to insufficient droplet spreading and liquid to fill the gaps between splats and substrate and between splats themselves. Chen (1996) developed a process-microstructure map for the UDS process as presented in Figure 2.7. In this figure, porous structures are to be expected with the combination of high solid fraction droplets and rapid solidification (lower left corner). A SEM micrograph which presents a typical porous lamination top surface produced by the UDS process is shown in Figure 3.10. There are four spray-deposition conditions which can form porosity:
(1) The solid fraction of the impinging droplets is so high that insufficient molten material is available to fill the gaps.
(2) The splats solidify at a faster rate with a relatively cool substrate and thus the degree of droplet spreading to seal the pores completely is reduced.
(3) In the case of nonuniform mass flux distribution on the deposition surface, fewer droplets land on some portions of the deposition surface, therefore, the pores in the previously solidified deposit cannot be fully closed.
(4) The drops from satellites and splashing splats clog pores and obstruct molten material flowing in the gaps.
Table 3.2 Controlled process parameters for the study of porosity formation.
| Experiment No. |
|
|
|
|
|
| Crucible Temperature ( |
|
|
|
|
|
| Substrate Temperature ( |
|
|
|
|
|
| Perturbation Frequency (kHz) |
|
|
|
|
|
| Charging (V) |
|
|
|
|
|
| Substrate Speed (cm/s) |
|
|
|
|
|
| Track Gap (Spray Cone width) |
|
|
|
|
|
| Liquid Fraction (%) |
|
|
|
|
|
A set of experiments were performed to study the
effects of these conditions on porosity formation. The experimental conditions
are listed in Table 3.2. In Experiments 1 and 2, the only variable is the
substrate temperature. Figures 3.11 (a) and (b) show the SEM micrographs
of the top surface morphology of these two conditions. In Figure 3.11 (a),
the spherical shapes of droplets are maintained due to rapid solidification
on the cooler substrate at 160![]() .
Compared to Experiment 1, the splats in Experiment 2 have a higher degree
of spreading on the higher temperature surface (190
.
Compared to Experiment 1, the splats in Experiment 2 have a higher degree
of spreading on the higher temperature surface (190![]() )
and thus a less porous deposit formed as described in condition (1). However,
if the substrate temperature is too high, the droplet splats do not solidify
fast enough and may merge with neighboring splats or remelt previously
deposited layers. This degrades the deposit uniformity and, for very thin
laminations, produces a very porous structure as shown in Figure 3.12.
In experiments with tin laminations, the temperature on the deposition
surface is kept at least 15
)
and thus a less porous deposit formed as described in condition (1). However,
if the substrate temperature is too high, the droplet splats do not solidify
fast enough and may merge with neighboring splats or remelt previously
deposited layers. This degrades the deposit uniformity and, for very thin
laminations, produces a very porous structure as shown in Figure 3.12.
In experiments with tin laminations, the temperature on the deposition
surface is kept at least 15![]() below the melting point of pure tin (232
below the melting point of pure tin (232![]() ).
).
(a) (b)
(c) (d)
Figure 3.11 SEM pictures with varying experimental conditions to demonstrate effects of droplet liquid fraction, substrate temperature, track gap, and satellites on the formation of porosity. Pictures (a) to (d) respectively present the results of Experiment 1 to 4 listed in Table 4.2.
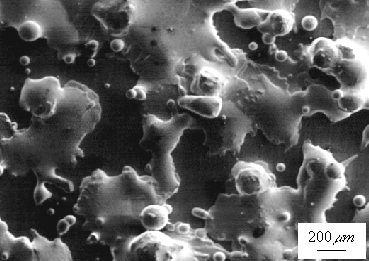
Figure 3.12 SEM picture to show the porous lamination deposited on a excessive high temperature substrate. The dark portion is the substrate surface beneath the lamination.
The effect of liquid fraction was investigated in Experiments 2 and 3. When the liquid fraction of the impinging droplets was increased from 0.8 to 0.95, as shown in Figures 3.11 (b) and (c), much molten material spread to the extent of the interstices and left fewer pores in the deposit. As expected, fewer traces of solids formed prior to
to quenching can be seen in Figure 3.11 (b) from the surface morphology and thus a more smooth surface can be produced by spraying high liquid fraction droplets.
Experiments 2 and 4 are used to verify the condition (3) by varying the track gaps from 1/4 to 1/2 of spray cone width. In Figures 3.11 (b) and (c), the deposit with the smaller track gap (Figure 3.11 (b)) shows a smoother and less porous surface than the deposit with the larger track gap (Figure 3.11 (d)). This is because a smaller track gap increases the degree of overlap between adjacent deposition path segments and therefore increases the unit-area mass flux on the deposition surface. A similar increase in mass flux can be gained by lowering the substrate speed. With higher mass flux, more droplets land in the same vicinity on the deposition surface and thus increases the possibility of filling the interstices. However, a higher mass flux produces thicker laminations and so is a poor correction for the porosity problem when thin laminations are required.
Satellites and splashing are generally considered undesirable. As described in Chapter 2, satellites can be eliminated by imposing the right frequency (Yim 1996). On the other hand, splashing during droplet impact is not yet clearly understood. In a raindrop study, the number of secondary splash droplets increased with impact velocity, droplet size, and surface roughness, which indicates a Reynolds number dependence (Stow et al. 1977). Hasui et al. (1970) showed that star-shaped alumina splats resulted from splashing upon impact with a low temperature substrate with a thermal spray. A consistent trend was also found with different metal droplets (Dykhuizen 1994). Although the materials and conditions of previous studies are different than this research, current tin experiments indicate that the substrate temperature, the droplet's Reynolds number (defined in section 3.3.1), and the surface roughness influence the final splat shape as well as the splashing behavior. As shown in Figure 3.11 (c), less droplet splashing was seen in Experiment 3 when the substrate temperature was increased with respect to Experiment 1. By increasing the track gap in Experiment 4, the roughness of the deposited layer increases. Therefore, Experiment 4 shows greater effects of droplet splashing than does Experiment 3.
3.4 Multi-layer Lamination Production
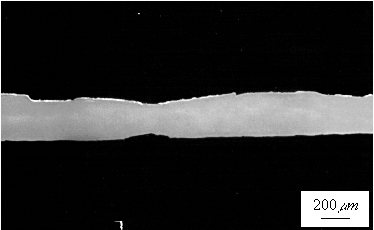
Section 3.3 has shown how to improve the uniformity, surface flatness, and porosity of each deposited lamination by optimizing some process parameters. The surface morphology of previously deposited laminations will also greatly affect the characteristics of the next layer. For examples, a wavy surface make it difficult to uniformly form another lamination on top. In addition, as mentioned in Section 3.3.3, the roughness of the prior surface will influence droplet spreading as well as splashing behaviors, and thus affect the porosity formation of the next lamination. Figure 3.13 shows the cross-section SEM micrograph of a stack of five-layer tin laminations. The dark layers between the bright laminations are interlaminar insulators (described in detail in next chapter). In this figure, the effect of the lower surfaces on the next lamination can be observed. For example, if the prior surface is very wavy, as is the third layer, the next layer might be made less wavy by spraying with a high mass flux and high deposition surface temperature. In this case, sufficient liquid can be fed locally into the valleys of the prior deposited lamination surface before solidification. Consequently, a much flatter surface can be produced. On the other hand, if the surfaces of the prior laminations are slightly wavy, the surface flatness of the final laminations will eventually become wavy due to the accumulation of surface waviness in each lamination. This can be explained by considering the decrease of liquid splat mobility on a flatter deposition surface.
The effects of surface waviness on the electrical as well as the
magnetic properties of laminations should be investigated to set a tolerance
for the uniformity and surface waviness for every layer of laminations.
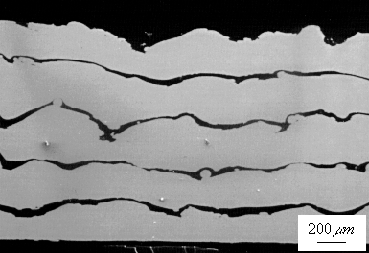
Figure 3.13 SEM picture for a stack of five-layer tin laminations with interlaminar insulation.
Chapter 4 Interlaminar Insulation
4.1 Introduction
To minimize the eddy current lost in the stator, the stator cores comprise stacks of thin laminations. The laminations must be insulated from one another for best results. The simplest way is to coat a thin insulative coating on each lamination surface. In this coating process, the insulation materials applied and the thickness of the coating layer are critical to the insulation effectiveness, and therefore greatly affect the performance of induction motors, especially when the speed and power ratings of a machine are quite high.
Typically, the coating materials used for high frequency induction motors consist of inorganic or organic varnishes and fillers. The varnishes act as film-formers and the fillers enhance the electrical resistance of the coating. The insulation materials are applied to the punched sheet surfaces by roller coating to give a uniform coating (usually from 1~3 µm) and then are continuously cured. Through this processing, the chemically and thermally treated surfaces provide a uniform, high-resistance insulation that withstand the following stress-relief-annealing and other post-machining operations.
In near-net-shape processes, like the UDS process, the coating operation should be redesigned and included in the current spray-deposition process as a integral part of stator production. A consideration in designing the coating operation is to choose a material for coating that meets the spray-deposition conditions. In contrast to conventional coating on flat rolled sheets, insulative materials should be applied to the much rougher surface at a higher temperature. The formed insulative layer must withstand the impinging of hot droplets from the spraying of the next lamination. The choice of coating materials also depends on the processes available used to create the interlaminar insulation. In this study, several coating materials were used to test the effectiveness of interlaminar electrical resistance. Two-layered tin laminations were examined for their surface insulative resistivities to study the electrical properties of the interlaminar insulators. An equivalent electrical network model was used to characterize the interlaminar insulation.
4.2 Insulation Materials
The four materials listed in Table 4.1 were applied between tin laminations as insulation. In addition to electrical resistance, these materials were examined for the capability to withstand droplet impact and higher deposition temperatures when the next layer of laminate is deposited. Results are also shown in Table 4.1.
Table 4.1 Results of selection of interlaminar insulation materials.
| Material
Requirement |
|
|
|
|
|
|
Bad (~50nm) |
|
|
|
|
|
Bad |
|
|
|
|
|
|
|
|
|
4.2.1 Oxide layer
The simplest way to produce an interlaminar insulator is to grow
an oxide layer after the deposition of each lamination. An adequately thick
oxide layer (a few microns deep) must be formed on the each tin lamination
surface to provide good insulation. Britton and Bright (1957) used catholic
reduction to estimate the thickness of the oxide layer formed on heated
tin (99.99%) plate. Their experimental data showed that the thickness of
the oxide film is about 8 nm after heating at 210![]() for 30 minutes in air. The oxide layer grew parabolically with time. The
results indicate that allowing a thick enough oxide film to form would
take too much time and therefore adversely affect the throughput of the
process. Since the oxidation rate for liquid tin is much faster than solid
tin, in the UDS practice, the melt was superheated (360
for 30 minutes in air. The oxide layer grew parabolically with time. The
results indicate that allowing a thick enough oxide film to form would
take too much time and therefore adversely affect the throughput of the
process. Since the oxidation rate for liquid tin is much faster than solid
tin, in the UDS practice, the melt was superheated (360![]() at crucible) and the substrate was kept at the temperature around the melting
point of tin (230
at crucible) and the substrate was kept at the temperature around the melting
point of tin (230![]() ) to maintain
the liquid state of droplet splats for a longer time. However, if the local
solidification time is too long, instead of forming a flat tin lamination,
the droplets merge into a large splat due to surface tension. In the UDS
environment, the oxygen level should be controlled to prevent unsteady
break-up due to the oxide formation in the crucible (Yim 1996). This limitation
of oxygen concentration in the chamber also sets a upper limit on the oxide
layer growth rate since the growth rate decreases with oxygen partial pressure
in the spray environment. As a result, the oxygen level was set below 750
ppm with a 100 µm orifice to ensure uniform break-up. Using Auger
spectroscopy, it was determined that an approximately 6 nm thick oxide
layer was formed on the lamination surface. A layer of 6 nm is too thin
and seems easily damaged by droplet impact during the formation of the
next lamination. A longer solidification time for a thicker oxide layer
is not feasible because the geometry and uniformity of laminations degrade
due to droplet merging.
) to maintain
the liquid state of droplet splats for a longer time. However, if the local
solidification time is too long, instead of forming a flat tin lamination,
the droplets merge into a large splat due to surface tension. In the UDS
environment, the oxygen level should be controlled to prevent unsteady
break-up due to the oxide formation in the crucible (Yim 1996). This limitation
of oxygen concentration in the chamber also sets a upper limit on the oxide
layer growth rate since the growth rate decreases with oxygen partial pressure
in the spray environment. As a result, the oxygen level was set below 750
ppm with a 100 µm orifice to ensure uniform break-up. Using Auger
spectroscopy, it was determined that an approximately 6 nm thick oxide
layer was formed on the lamination surface. A layer of 6 nm is too thin
and seems easily damaged by droplet impact during the formation of the
next lamination. A longer solidification time for a thicker oxide layer
is not feasible because the geometry and uniformity of laminations degrade
due to droplet merging.
4.2.2 C-5 Varnish
Based on the surface insulation resistance, the chemical content
of insulation and its resistance to stress-relief-annealing, the American
Iron and Steel Institute (AISI) classifies core plate surface insulation
into six different types, from C-0 to C-5. The C-5 insulation is an inorganic
insulation with ceramic fillers added to enhance electrical resistance.
High resistance makes this insulation desirable for large cores with a
volts per turn ratio in the highest range. Laminations with C-5 insulation
are particularly suitable for large motors and generators with high frequency
and highly sensitive performance application. The C-5 insulation usually
can withstand stress-relief-annealing up to 800![]() and provide sufficient hardness after curing. Due to these properties,
C-5 is one of the best choices for interlaminar insulation to provide sufficient
insulation and to withstand the droplet impact and deposition temperature
of the next layer. The only drawback is that the curing temperature of
the available C-5 varnish (REMISOL #EB5302) is higher than the melting
point of pure tin. Therefore, the C-5 coating is not suitable for the current
study of insulation of tin laminations. However, it is a good candidate
of interlaminar insulation for future research on Fe-Si laminations.
and provide sufficient hardness after curing. Due to these properties,
C-5 is one of the best choices for interlaminar insulation to provide sufficient
insulation and to withstand the droplet impact and deposition temperature
of the next layer. The only drawback is that the curing temperature of
the available C-5 varnish (REMISOL #EB5302) is higher than the melting
point of pure tin. Therefore, the C-5 coating is not suitable for the current
study of insulation of tin laminations. However, it is a good candidate
of interlaminar insulation for future research on Fe-Si laminations.
4.2.3 Aramid Fiber Paper
Another choice of insulation material is aramid fiber paper (DuPont Nomex 410). Due to its excellent dielectric strength, mechanical toughness, and thermal stability, this paper is used for electrical insulation in electric motors, electromechanical equipment, and transformers. Some important properties of this paper are listed in Table 4.2. Although this insulation paper can withstand the droplet impact and high deposition temperature, the gaps left between the paper and laminations reduce the magnetic material volume in a lamination stack. Since there is no physical or chemical bonding between the paper and laminations, more operations must be done to fasten them together. Because these factors, this fiber paper is not used in stacking multi-layer laminations.
Table 4.2 Important properties of the Nomex 410 type aramid paper.
|
|
|
|
|
|
|
|
|
|
|
|
4.2.4 Acrylic Lacquer
Another approach to interlaminar insulation is to apply an organic
material on each lamination surface. One such material, Krylon stove paint,
can withstand high temperature (up to 650![]() intermittently) and was used for these experiments. The composition of
this lacquer is based on an acrylic resin dissolved in organic solvents
(toluene and acetone mixture) and stored in the pressurized spray can.
The acrylic resin constitutes the film-forming vehicle in which the pigments
and other ingredients are dispersed to give the desired color, thermal,
and electrical properties to the dried film. After spraying on the lamination
surfaces, the lacquer dries by solvent evaporation. Table 4.1 shows that
this acrylic lacquer provides good insulation resistance and can withstand
the droplet impact and high substrate temperature. In addition, no gap
is observed between the insulator and lamination. The disadvantage is that
the solvent is flammable, making it difficult to combine the coating application
with the UDS process on the hot deposition surface. However, the acrylic
lacquer was useful in this study to characterize the electrical properties
of interlaminar insulation by applying the insulation outside the spray
chamber. The results can be generalized to other coating methods or materials
in future insulator research on Fe-Si laminations. These will be discussed
at the end of this chapter.
intermittently) and was used for these experiments. The composition of
this lacquer is based on an acrylic resin dissolved in organic solvents
(toluene and acetone mixture) and stored in the pressurized spray can.
The acrylic resin constitutes the film-forming vehicle in which the pigments
and other ingredients are dispersed to give the desired color, thermal,
and electrical properties to the dried film. After spraying on the lamination
surfaces, the lacquer dries by solvent evaporation. Table 4.1 shows that
this acrylic lacquer provides good insulation resistance and can withstand
the droplet impact and high substrate temperature. In addition, no gap
is observed between the insulator and lamination. The disadvantage is that
the solvent is flammable, making it difficult to combine the coating application
with the UDS process on the hot deposition surface. However, the acrylic
lacquer was useful in this study to characterize the electrical properties
of interlaminar insulation by applying the insulation outside the spray
chamber. The results can be generalized to other coating methods or materials
in future insulator research on Fe-Si laminations. These will be discussed
at the end of this chapter.
4.3 Deposition of Insulation Layers
It is important to apply insulation layers as uniform as possible to gain the best electrical insulation properties. In addition, the insulation layers must be thin to obtain the maximum magnetic strength in the stator cores. For cold-rolled laminations, it is easy to control the uniformity and thickness of surface insulation layers by adjusting the relative speed of the coating roller and metal strips and the clearance between them. In contrast, since the surface roughness of laminations produced by the UDS process is different from that of cold-rolled sheets, the roller coating technique is not adequate to produce a thin and uniform insulation layer on the lamination surface. One of the alternatives is to spray the insulation material on the previous laminate surface and then use a brush to improve uniformity of coating. By holding a can of acrylic lacquer 0.25 to 0.30 m from the surface, the atomized paint particles will uniformly distribute on the working surface. To prevent dripping, it is better to apply few light coats rather than one heavier coat and to use a brush to disperse paint from the concavities on the previous lamination surface before the coat dries. The thickness of the coating is determined by adjusting the mass flux from the spray can, the distance between the spray nozzle and coated surface, speed of nozzle motion, and the number of light coats to finish an insulator. Figure 3.19 shows a stack of five-layer tin laminations with four interlaminar insulation layers produced in this manner. The average thickness of the insulation layers is approximately 25 µm.
4.4 Measurement of Insulation Layers
4.4.1 Standard Procedures
A standard test method (ASTM A718) is used to assess the insulation
quality by measuring the interlaminar insulation resistance of multi-strip
specimens of laminations produced by the UDS process. The dimensions of
the specimens are listed in Table 4.3. Usually the test specimen consists
of 40 strips, 250 mm in length, and 30 mm in width. However, because the
prime focus of the current study is the characteristics of insulators and
their effects on interlaminar insulation properties, a stack of two-layer
laminations is used in current measurement and the specimen dimensions
is based on the available stack size. The measurement apparatus is shown
schematically in Figure 4.1. The measurement is made under pressure with
the compression force applied to the specimen by a pair of compression
heads. The insulation blocks (wooden blocks) insulate the compression heads
and copper plates. The blocks are slightly bigger than the copper plate
with sufficient thickness to withstand the specified pressure without undue
bending. The copper plates overhanging the test specimen at each end by
10 mm are soldered with two flexible copper cables which connect to a steady
DC voltage source with a range from 1.5 to 12 V (Radio Shack, AC Adapter,
Cat No. 273-1662). Two multi-meters are connected in series and parallel
respectively with the voltage source to concurrently measure the voltage
and current across the specimen.
Table 4.3 Dimensions of specimens used in insulation measurements
| Specimen No. |
|
|
|
|
| Dimensions ( |
|
|
|
|
| Area ( |
|
|
|
|
The test procedures are summarized as following:
(1) Rest the specimen symmetrically on the bottom copper plates. Support this arrangement on one insulation block; then symmetrically place another copper plate and insulation block on the top of the specimen.
(2) Rest this setting in the compression device and adjust it by distributing pressure uniformly through the specimen.
(3) Connect the cables with the voltage source and multi-meters.
(4) Subject the specimen to a preloading pressure of 3.5 MPa and then reduce the pressure to zero before applying the test pressure.
(5) Apply the test pressure of 2.1 MPa recommended by the standard.
(6) Measure the voltage and current with the arrangement shown in Figure 4.1.
4.4.2 Results and Discussion
The measurements made at specified preloading and
test pressures are shown in Figure 4.2. The effectiveness of a surface
insulative coating is represented by surface insulation resistivity, ![]() ,
in
,
in ![]() , as follows:
, as follows:
![]() (4.1)
(4.1)
where ![]() is
the lamination surface area in
is
the lamination surface area in ![]() ,
, ![]() the
measured resistance of a stack in
the
measured resistance of a stack in ![]() ,
and
,
and ![]() the number of interlaminar
insulation layers. The measured resistance can be converted directly from
the multi-meter readings by Ohm's Law:
the number of interlaminar
insulation layers. The measured resistance can be converted directly from
the multi-meter readings by Ohm's Law:
![]() (4.2)
(4.2)
where ![]() is
the voltage in volt and
is
the voltage in volt and ![]() the
current in ampere which are separately read from the multi-meters shown
in Figure 4.1.
the
current in ampere which are separately read from the multi-meters shown
in Figure 4.1.
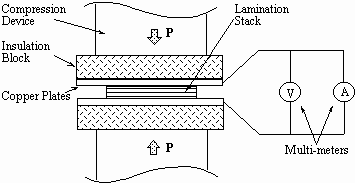
Figure 4.1 Schematic diagram of apparatus for insulation measurements.
The results in Figure 4.2 shows that the surface insulation resistivities, ![]() ,
of the two-layer tin lamination at 300 MPa test pressure are above 80
,
of the two-layer tin lamination at 300 MPa test pressure are above 80 ![]() ,
except specimen 2, and that resistivity decreases with increasing pressure
on the laminations for all four specimens. The deviation of specimen 2
will be discussed in next section. The thickness of the insulative layer
can be estimated by averaging the thickness on the four cut edges for each
specimen and then averaging those averages. The measured value is about
50
,
except specimen 2, and that resistivity decreases with increasing pressure
on the laminations for all four specimens. The deviation of specimen 2
will be discussed in next section. The thickness of the insulative layer
can be estimated by averaging the thickness on the four cut edges for each
specimen and then averaging those averages. The measured value is about
50 ![]() for this two-layer tin
stack. As a comparison, the surface insulation resistivity on the Fe-Si
core lamination surfaces with 3.5 µm thick C-5 kind of insulation
is around 40
for this two-layer tin
stack. As a comparison, the surface insulation resistivity on the Fe-Si
core lamination surfaces with 3.5 µm thick C-5 kind of insulation
is around 40 ![]() before annealing
and reduces to 25
before annealing
and reduces to 25 ![]() after
annealing (Rembrandtin 1995).
after
annealing (Rembrandtin 1995).
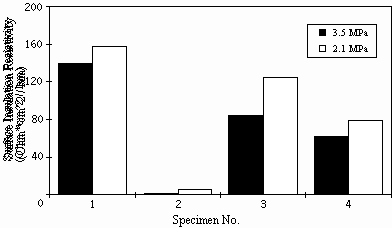
Figure 4.2 Measurements for two-layer tin lamination specimens.
The quality of interlaminar insulators can be represented quantitatively by measuring the surface insulation resistivity of the laminations. If we assume that the thickness and deposition conditions for each interlaminar insulator are the same, Equation (4.1) can be rewritten as:
![]() (4.3)
(4.3)
where ![]() is the surface
resistance of a single lamination with one insulator on its surface in
is the surface
resistance of a single lamination with one insulator on its surface in ![]() .
Physically, the resistance of the insulator can be modeled as unit area
resistors in parallel. The insulator resistance is then connected in series
with the resistance of the tin lamination. This equivalent circuit model
is shown in Figure 4.3. Note that the resistance of the laminations is
negligible because they are usually made of
.
Physically, the resistance of the insulator can be modeled as unit area
resistors in parallel. The insulator resistance is then connected in series
with the resistance of the tin lamination. This equivalent circuit model
is shown in Figure 4.3. Note that the resistance of the laminations is
negligible because they are usually made of
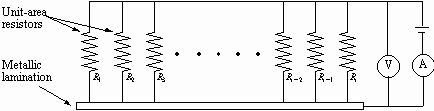
Figure 4.3 Equivalent circuit of one lamination with a single layer of insulation on its surface.
conductive material. Since the resistance of the insulator is much
greater than the conductive lamination, the lamination resistance can be
neglected. For this reason, we can evaluate the insulation resistance ![]() in
another way:
in
another way:
 (4.5)
(4.5)
where ![]() is the j-th
unit-area resistor of insulator in
is the j-th
unit-area resistor of insulator in ![]() ,
and
,
and ![]() is the total number
of unit areas. In the conventional case, since laminations are stacked
by cold-rolled sheets with a flat and uniform insulation coating on them,
the resistance of every unit-area resistor at any location can be assumed
to have the same
is the total number
of unit areas. In the conventional case, since laminations are stacked
by cold-rolled sheets with a flat and uniform insulation coating on them,
the resistance of every unit-area resistor at any location can be assumed
to have the same ![]() . By using
Equation (4.5) and the relation between
. By using
Equation (4.5) and the relation between ![]() and
and ![]() ,
, ![]() is
found to be equal to this
is
found to be equal to this ![]() .
This value represents the average insulative property of the insulator
per unit area and, therefore, can be used to indicate the insulation capability
of the insulator between two laminations. However, in the UDS process,
since the lamination surfaces are rough, the interlaminar insulation layers
are less uniform. Therefore, the electrical resistance of the insulators
is dominated by some of the short-distance portions between adjacent laminations
which represent the unit-area resistors of smaller resistance in the equivalent
electrical network. In this case, the value
.
This value represents the average insulative property of the insulator
per unit area and, therefore, can be used to indicate the insulation capability
of the insulator between two laminations. However, in the UDS process,
since the lamination surfaces are rough, the interlaminar insulation layers
are less uniform. Therefore, the electrical resistance of the insulators
is dominated by some of the short-distance portions between adjacent laminations
which represent the unit-area resistors of smaller resistance in the equivalent
electrical network. In this case, the value ![]() still
can indicate the quality of insulators but cannot represent the average
resistance between laminations. Once there is a short circuit at any portion
between two adjacent laminations, the surface resistance of any single
layer insulator in Equation (4.5) will go down to nearly zero. From Equation
(4.4), the surface insulation resistivity will also approach zero although
the other portions of the insulator are thick enough to provide good insulation.
That is why the surface resistivity of specimen 2 of Figure 4.2 is much
lower than the other three specimens. The location from which the specimen
2 was cut is shown in Figure 4.4. Somewhere in that area there should be
a short circuit between the laminations.
still
can indicate the quality of insulators but cannot represent the average
resistance between laminations. Once there is a short circuit at any portion
between two adjacent laminations, the surface resistance of any single
layer insulator in Equation (4.5) will go down to nearly zero. From Equation
(4.4), the surface insulation resistivity will also approach zero although
the other portions of the insulator are thick enough to provide good insulation.
That is why the surface resistivity of specimen 2 of Figure 4.2 is much
lower than the other three specimens. The location from which the specimen
2 was cut is shown in Figure 4.4. Somewhere in that area there should be
a short circuit between the laminations.
The two most important factors in avoiding a short circuit between laminations and thus increasing the effectiveness of an insulative coating are:
(1) to increase the surface flatness of the prior lamination surface, and
(2) to apply a uniform interlaminar insulative coating.
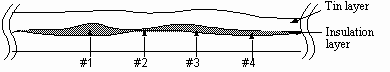
Figure 4.4 Schematic illustration of the possible positions from which the specimens were cut.
Chapter 5 Summary
5.1 Summary
The goal of this research was to study the feasibility of producing laminations by the UDS process. To achieve this goal, firstly, the effects of the UDS process parameters on lamination characteristics, such as thickness, uniformity and porosity, were explored. The results are summarized as following:
(1) A layer of 127 µm tin lamination was produced using 200 µm droplets. A thinner lamination can be produced by spraying smaller droplets with high liquid fraction on a sufficient hot substrate.
(2) The surface flatness and uniformity of laminations can be improved by selecting the proper mass flux distribution and by increasing the degree of deposit overlap between adjacent path segments and between layers.
(3) Porosity either within or on the surface of the deposit can be reduced or eliminated by spraying high liquid fraction droplets onto a sufficiently high hot deposition surface. However, the substrate temperature cannot be so high as to cause neighboring splats to merge. This will degrade lamination uniformity.
(4) A proof-of-concept stack of five-layer tin laminations was produced by the UDS process and examined for its thickness, consolidation, and electrical properties. The slight waviness on each lamination surface accumulates and results in a much rougher top surface on the final multi-layered deposit.
Another important issue for successfully producing laminations by the UDS process is to choose an appropriate interlaminar insulation material and application method. A sprayed acrylic lacquer was used to study insulation properties. The experimental results show that the effectiveness of interlaminar insulators is determined by the properties of the insulation material, the thickness, and the uniformity of the insulation layers. The surface insulation resistivity decreases dramatically once there is a short circuit between adjacent laminations.
5.2 Future Work
On the basis of the results of this current study on tin laminations, future research will focus on the production of Fe-Si laminations. The following tasks should be continued:
(1) Build up a high temperature spray system capable of generating Fe-Si droplets.
(2) Establish a model to relate the microstructure evolution of the deposited laminations to the spray conditions: this study will focus on developing a grain size prediction model as an analytical foundation for deposit microstructure control.
(3) Study the magnetic properties of the laminations: optimum magnetic properties in Fe-Si laminations are strongly coupled to grain size and size distribution. Based on Chen's study (1996), the UDS process can control the grain size and other microstructure characteristics of the deposit by controlling the droplet thermal state, deposit thermal state, and other conditions. Future work should investigate the relations between the magnetic properties of laminations and their microstructure characteristics.
(4) Design a insulation application process integrated with the existing
UDS process to simplify the procedure of lamination fabrication.
Bibliography
Abel, G.K., 1993, "Characterization of Droplet Flight Path and Mass Flux in Droplet-Based Manufacturing," S.M. Thesis, Department of Mechanical Engineering, MIT.
Acquaviva, P.J., 1995, "Modeling of Deposition Solidification in Droplet Based Manufacturing," S.M. Thesis, Department of Mechanical Engineering, MIT.
ASTM Committee, 1996, "Annual Book of ASTM Standards," sec. 3, vol. 03.04, pp. 141-142, American Society for Testing and Materials.
Brandes, E.A. and Brook, G.B., 1992, "Smithells Metals Reference Book," 7th ed., Butterworth-Heineman Ltd.
Britton, S.C. and Bright, K., 1957, "An Examination of Oxide Films on Tin and Tinplate," Metallurgia, vol. 24, no. 10, pp. 163-168.
Brown, C.P., 1996, "Design for Manufacturability of a High-Performance Induction Motor Rotor," S.M. Thesis, Department of Mechanical Engineering, MIT.
Chen, C.-A., 1996, "Droplet Solidification and Its Effects on Deposit Microstructure in the Uniform Droplet Spray Process," Ph.D. Thesis, Department of Mechanical Engineering, MIT.
Chen, C.-A., Acquaviva, P.J., Chun, J.-H., and Ando, T., 1996, "Effects of Droplet Thermal State on Deposit Microstructure in Spray Forming," Scripta Materialia, vol. 34, no. 5, pp. 689-696.
Cherng, J.-P., 1997, "Solidification and Cooling Analysis of Aluminum Alloy Droplets with the Uniform Droplet Spray Process," S.M. Thesis, Department of Mechanical Engineering, MIT.
DuPont, Inc., 1997, "Typical Properties of Nomex' Type 410," Active Industries, Inc.
Dykhuizen, R.C., 1994, "Review of Impact and Solidification of Molten Thermal Spray Droplets," Journal of Thermal Spray Technology, vol. 3(4), pp. 351-361.
Fasching, M.M., Prinz, F.B., and Weiss, L.E., 1993, "Planning Robotic Trajectories for Thermal Spray Shape Deposition," Journal of Thermal Spray Technology, vol. 2, pp. 45-50.
Fukanuma, H., 1994, "A Porosity Formation and Flattening Model of an Impinging Molten Particle in Thermal Spray Coatings," Journal of Thermal Spray Technology, vol. 3, pp. 33-44.
Gao, F. and Sonin, A.A., 1994, "Precise Deposition
of Molten Microdrops: the Physics of Digital Microfabrication," Proceedings
of the Royal Society of London, A, vol. 444, pp. 533-554.
Hasui, A., Kitahara, S., and Fukushima, T., 1970, " On Relation between Properties of Coating and Spraying Angle in Plasma Jet Spraying," Transactions of National Research Institute for Metals (Japan), vol. 12, no. 1, pp. 9-20.
Kalpakjian, S., 1995, "Manufacturing Engineering and Technology," 3rd ed., Addison-Wesley Pub. Co.
Kim, H.-Y., 1996, "Microsensor Development for the Study of Droplet Spreading," S.M. Thesis, Department of Mechanical Engineering, MIT.
Kubaschewski, O. and Hopkins, B.E., 1962, "Oxidation of Metals and Alloys," 2nd ed., Butterworths, London.
Mulholland, J.A., Srivastava, R.K., and Wendt, J.O.L., 1988, "Influence of Droplet Spacing on Drag Coefficient in Nonevaporating, Monodisperse Streams," AIAA Journal, vol. 26, pp. 1231-1237.
Passow, C.H., 1992, "A Study of Spray Forming Using Uniform Droplet Sprays," S.M. Thesis, Department of Mechanical Engineering, MIT.
Photo Laminations, Inc., 1996, "About Proto Laminations," Proto Laminations, Inc.
Rayleigh, Lord, 1878, "On the Instability of Jets," Proceedings of London Mathematical Society, vol. 10, pp. 4-13.
Rembrandtin, Inc., 1995, "Technical Data Sheet of REMISOL Core Sheet Varnish," Rembrandtin, Inc., Austria.
Slandler, M.H., 1978, "Metals Handbook," 9th ed., vol.5, pp. 471-508, American Society of Metals.
Slemon, G.R. and Straughen, A., 1980, "Electric Machines," Addison-Wesley Pub. Co.
Stow, C.D., and Hadfield, M.G., 1981, "An Experimental Investigation of Fluid Flow Resulting from the Impact of a Water Drop with an Unyielding Dry Surface," Proceedings of the Royal Society of London, A, vol. 373, pp. 419-441.
Shutts, C.J., 1995, "Development of a Reliable Electrostatic Multijet Printhead for Three Dimensional Printing," S.M. Thesis, Department of Mechanical Engineering, MIT.
Yim, P., 1996, "The Role of Surface Oxidation in
the Break-Up of Laminar Liquid Metal Jets," Ph.D. Thesis, Department of
Mechanical Engineering, MIT.