This is an intuitive analytical tool to dissect the complex relationships found among data, teasing out the factors that define the current and future states of epidemics worldwide. For example, what relationships exist between environmental factors, human dynamics, adaptable genomes, and disease prevalence in a region? What other factors have an impact on this relationship? This project aims to develop an intelligent tool for simultaneously analyzing and visualizing massive amounts of data that may directly, or indirectly, influence disease behavior and interaction.


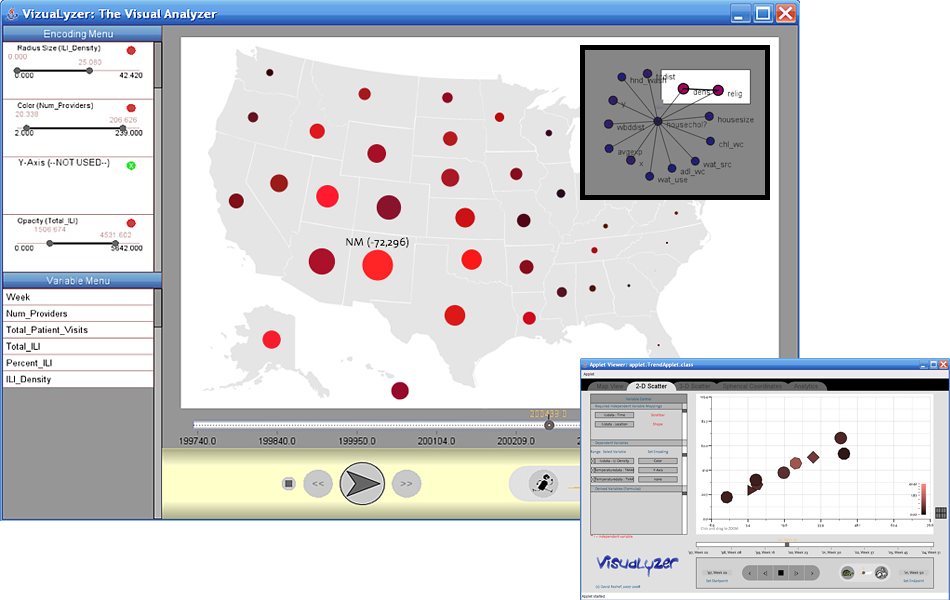
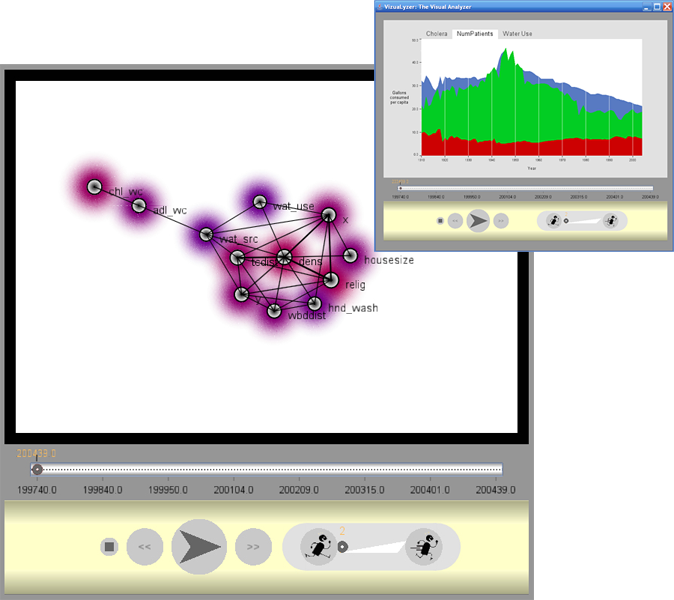
The Blend of Computational Power and Computer Science

Today’s wealth of collected data has become overwhelming. In turn, the identification of potential predictive variables from within highly multi-dimensional spaces is incredibly unintuitive and has become computationally difficult. VisuaLyzer’s novel algorithmic approach aims to identify the most relevant dimensions within datasets for analysis, extracting the most essential important relationships among variables. Furthermore, in creating intelligent and intuitive visualizations for the results of its data mining expeditions among seemingly unrelated data, patterns become obvious and previously unnoticed relationships emerge. VisuaLyzer mines the complex and rapidly expanding datasets within public health to understand how epidemics emerge and propagate in a target population. Please view the Video below to see an example of a few basic visualizations and algorithmic techniques.


CLICK PLAY BELOW TO BEING VIDEO DEMONSTRATION


This video requires JavaScript to be enabled and the latest version of the Macromedia Flash Player.
Please update your version of the free Flash Player by downloading here.


A Three-Pronged Approach to Analysis:

VisuaLyzer’s strength is in identifying information across multiple separate datasets that may link to disease patterns. This is done in three stages:

  1. Exploratory data analysis: Applying existing and novel statistics, machine learning algorithms, and artificial intelligence techniques to identify all existing associations among any set of variables across datasets, in a model-independent manner. The uniqueness of this agnostic method allows it to rank objectively all found associations by strength.
  2. Real-Time, dynamic visualization: Exploring the identified critical associations and variables using a set of intuitive visualizations which allow the researcher to see seven, eight, or even nine dimensions at a time.
  3. Intelligent Modeling: Using the computer-identified associations, together human intuition gathered through human interaction with the visualizations, to intelligently and automatically model disease phenomena.


For more information, please contact David Reshef at: dnreshef at mit dot edu