Asymmetry in the Response of Aquifer Water Level to Droughts and Floods in Illinois
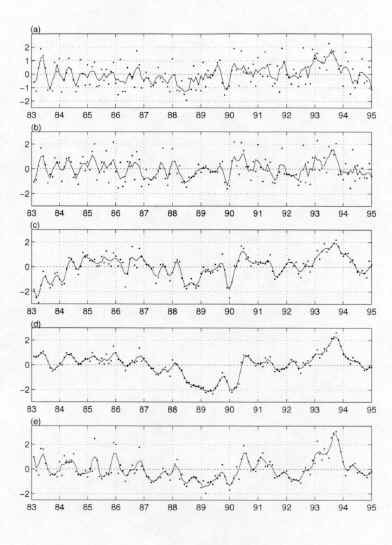
In a recent study, Eltahir and Yeh (1999) presents a comprehensive data set on the hydrological cycle of Illinois. The following figure, taken from their paper, describes the propagation of hydrological floods and droughts from the atmosphere into the soil and down to the groundwater aquifers. If we focus on major events: the drought of 1988 and the flood of 1993, we can observe that the aquifer tends to amplify the drought and to dissipate the flood.
Time series of the normalized anomalies of monthly (dots) (a)atmospheric
moisture convergence, (b) precipitation, (c) soil moisture content, (d) groundwater
level, (e) river flow from 1983 to 1994 in Illinois. The continuous line is a 12 month
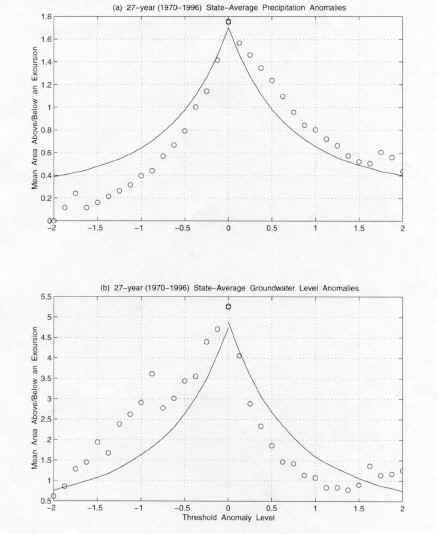
average.These observations motivated a more careful look at longer records of precipitation and aquifer water level. Eltahir and Yeh (1999) estimated the average size of droughts and floods in precipitation and aquifer level. The following figure compares the statistics of floods and droughts defined according to different threshold values, and confirms the previous observation that aquifers tend to amplify the droughts and to dissipate the floods.
Mean area above (below) an dexcursion corresponding to positive (negative)
threshold levels for (a) precipitation, (b) groudwater level. Continuous lines describe
the theoretcial relations for a symmetric Gaussian stochastic process that has the
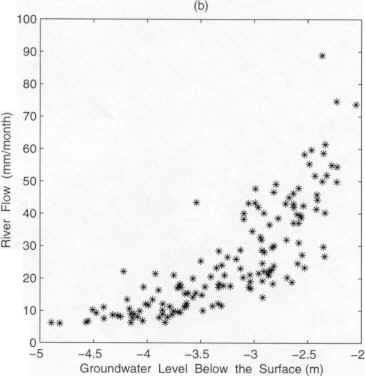
same mean, standard deviation, and the auto-correlation coefficient at lag one.Eltahir and Yeh (1999) offered an explanation for these observations. The discharge from unconfined groundwater aquifers to streams (base-flow) provides an efficient dissipation mechanism for the wet anomalies in aquifer water level. However, the non-linear dependence of discharge on aquifer water level (groundwater rating curve) may explain why droughts leave a significantly more persistent signature on groundwater hydrology, in comparison to the signature of floods. As the groundwater level rises the discharge to streams increases rapidly resulting in dissipation of floods.
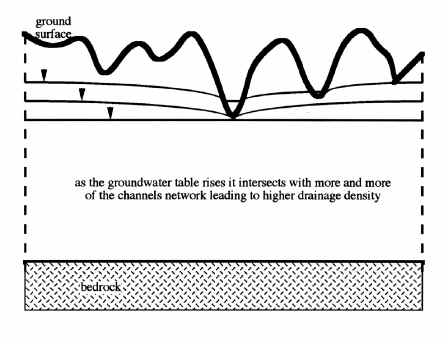
Plot of groundwater level versus monthly river flow during 1983-1994 in Illinois.Eltahir and Yeh (1999) attribute this non-linearity to the increasing degree by which the unconfined aquifers get connected to the channels network, as the aquifer water level rises leading to higher drainage density.
A schematic figure that illustrates the relationship between aquifer
water level and drainage density.
Back to Highlights of Research