Dataset Information
Information on Climate Station
Data
Information on grided data:
Climate station data
The monthly precipitation
data presented on this web-page were obtained from 2 different surces:
For the climate stations Masirah and Thumrait the data come from “NNDC
climate stations online”.
For the stations Quairoon Hairitti and and Salalah precipitation data
printed in Kahlid, 2000 ( ) . See table 1 for information for more
|
The stations are located as follows (compare
figure. 1): Salalah lies in the coastal plain of Dhofar in immediate proximity
to the Arabian Sea. Quairoon Hairitti and Thumrait lie further North,
Quairoon in the Dhofar mountains, but behind the mountain crest and outside
of the highly vegetated zone. Thumrait lies in the dessert behind the
mountains, nearly at the same elevation as Salalah.
Masirah lies on an island about 500km to the northeast of Salalah. Although
Masirah is located far away from Salalah it is worthwhile looking at data
from this station to learn about the climate in Dhofar. Similarly to Salalah
also Masirah is located closed to the coast and interannual variations
in both climate stations are potentially sensitive to the same climate
features: monsoon and upwelling in the Arabian sea.
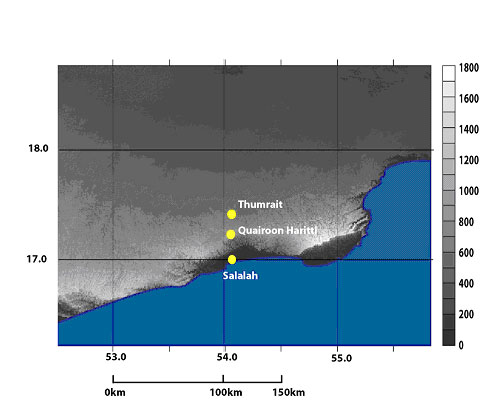
figure 1: location of climate stations in a topographic map of Dhofar, showing Salalah near the coast, further north Quairoon Hairiti immediately behind the mountain crest and Thumrait in the interior desert region. Masirah is located 500km northeast of this region and not included in this figure.
NNDC Climate
Stations online
This dataset can be downloaded for free at http://cdo.ncdc.noaa.gov/.
This website contains also further information.
| time coverage: | 1987-1999 monthly averaged |
| loacal coverage: | Masirah, Salalah, Thumrait |
| type of data: | rainfall, pressure, mean vapor pressure, temperature |
AL-Mashaikhi, K.S.A.
(1997)
These data were found in the print version of a masters thesis prepared
by Khalid Salim Ahmed AL-Mashaikhi. The complete reference is:
AL-Mashaikhi, K.S.A. (1997), Hydrogeochechemestry of the Salalah Region,
Sultanate of Oman. Unpublished master Theses, Flinders University of South
Australia.
Grided Data
GISST
- Global Sea Ice and SST Data
This Dataset was produced by the UK Meteorological Office. The dataset
can only be received after application, however it is free. More information
about the dataset and the application process can be found at http://www.badc.rl.ac.uk/data/gisst/.
| time coverage: | 1871 – present, monthly averages |
| spatial coverage: | world wide, 1deg x 1deg resolution |
| type of data: | sea surface temperature |
| processing: | statistically created dataset including EOF reconstruction |
COADS - Comprehensive
Ocean-Atmosphere Dataset
Dataset provided by NOAA-CIRES Climate Diagnostics Center for free. More
information can be found at http://www.cdc.noaa.gov/coads/coads_cdc_netcdf.shtml.
| time and spatial coverage: | • for 1deg x 1deg: 1960 – 1997 • for 2deg x 2deg: 1800 – 1997 • equatorial (10.5N to 10.5S) and global • monthly averages |
| type of data: | wide range of data types available, including: wind, SST, air temperature sea level pressure, cloudiness, humidity |
| processing: | monthly averaged data from individual marine observations
- such as ships, buoy. data availability is dependent on ship routes
and changes with time . two types of trimming available:
• standard: edited using standard deviation limit of 3.5, includes mostly ship observation data • enhanced: edited using standard deviation limit of 4.5, includes also data and stationary marine platforms |
For our plots we used the 1deg and 2 deg enhanced datasets.
NCEP/NCAR reanalysis
Datasets
Dataset provided by NOAA-CIRES Climate Diagnostics center. More information
can be found at http://wesley.wwb.noaa.gov/reanalysis.html.
| time coverage: | 1948 – present, derived from 4times daily output |
| spatial coverage: | global, 2.5 X 2.5 deg |
| types of data: | wide range of data typed available, including: wind, SST, air temperature, radiation fluxes, clouds, precipitation, geopotential height, surface pressure etc. |
| processing: | dataset is based on a reanalysis of forecast model output and improved by incorporation of observation data |
GTOPO30
Is a global digital elevation model distributed by USGS. Information
about the dataset are available at http://edcdaac.usgs.gov/gtopo30/gtopo30.html.
| spatial coverage: | 30arc seconds (about 1km), global |
| types of data: | elevation abpve sea level in m |
| processing: | for the area of the Arabian Peninsula mostly derived from satellite data (90m) and in some gaps combined with vector cartographic data |
Global Vegetation Index
Provided by the GVI (Global Vegetation Index project) of NOAA, from the
Advanced Very High Resolution Radiometer. More information on the dataset
can be found at http://www2.ncdc.noaa.gov/docs/gviug/.
For our analysis we used NDVI (normalized
vegetation index) which is calculated as:
NDVI = channel2 - channel1 ,
channel2
+ channel1
where channel 1 and channel 2 are the values
of measured radiation at two different frequencies in the visible light
spectrum.
NDVI for vegetation cover ranges between values of 0.1 (little vegetation)
and 0.6 (dense vegetation).
| spatial coverage: | global, 0.15degree resolution |
| time coverage: | 1985-present |
| types of data: | NDVI, brightness temperature, precipitable water index |
| processing: | different levels available data used here are the third generation monthly product, C-level data made from weekly composite data. Weekly composite is the average of the 2 greenest days out of the seven weekly measurements. To find the monthly dataset these values are again averaged over 5 weeks. |