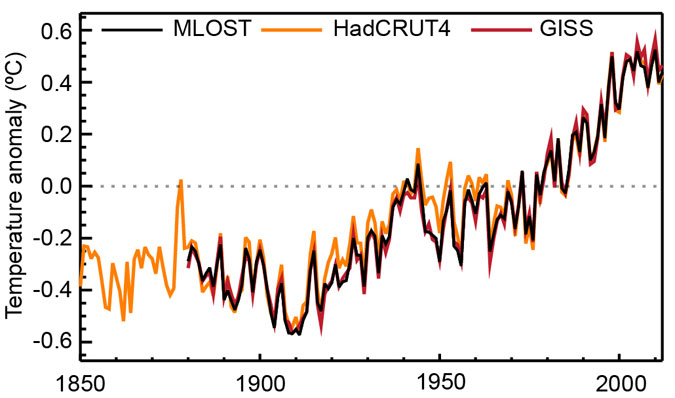
Figure 1. Annual global mean surface temperature anomalies relative to 1961–1990from three combined land-surface air
temperature and sea surface temperature datasets (HadCRUT4, GISS and MLOST). (From IPCC, WG1, 2013.)
| close this window |
| Campus Conversation on Climate Change | ||
| Annual Global Mean Surface Temperature Anomalies | ||
|
Figure 1. Annual global mean surface temperature anomalies relative to 1961–1990from three combined land-surface air |
||
|