import java.applet.*;
import java.awt.*;
import java.util.Date;
Syntax
public abstract class Jcalcomp
Description
This Jcalcomp class is a basic engineering drawing tool by usage
of Graphics. It generates user's original coordinates, contour line
graph and 3D graph.
Jcalcomp is extended from Applet class and user should make
their own class extended from Jcalcomp.
This class is named after Calcomp plotter library, which has been used
as a flatbed plotter library in FORTRAN library.
mshplt() draw 2D mesh system for contour plotting in physical and virtual coordinates.
contdraw() draw 2D contour lines or bands in physical and virtual coordinates.
Indexdraw() Index and its color patterns are drawn at arbitrary place
SetLevelTable() assign the value of index level
SetColorTable() assign color patterns
to index level
PARAMETERS :
[i][j] is specified [fdim*i+j]
m
Max of array x in target area
n
Max of array y in target area
xdim
1st dimension of Array x
ydim
1st dimension of Array y
fdim
1st dimension of Array flg
wid
size of x direction of target area in case of mod=1
hei
size of y direction of target area in case of mod=1
SEEALSO : contour()
EXAMPLE : see example of contour()
DESCRIPTION :
PARAMETERS :
SEEALSO : contour(),mshplt()
EXAMPLE : see example of contour()
SYNTAX :
void contdraw(Graphics g, int mod, double[] x,double[]
y,double[] f, char[] flg,double[] setlvl, int[]
stclr,int[] stlsy,int lvl,int m,int n, int xdim,int ydim,int vdim,int
fdim, double wid,double hei)
void contdraw(Graphics g, int mod, double[][] x2dim,double[][]
y2dim,double[][] f2dim, char[][] flg2dim,double[] setlvl,
int[] stclr,int[] stlsy,int lvl,int m,int n, double wid,double
hei)
void contdraw(Graphics g, int mod, double[][] x2dim,double[][]
y2dim,double[][] f2dim, char[][] flg2dim,
int m,int n)
void contdraw(Graphics g, int mod, double[][] x2dim,double[][]
y2dim,double[][] f2dim, char[][] flg2dim
,int m,int n, double wid,double hei)
DESCRIPTION :
Real coordinate system is specified by (x,y) and they are topologically
equal to virtual coordinate system.
Then given coordinate system by users is available in both system.
Settings of the cotour level is user's matter. Maximum of level
setting is depends upon array size of setlvl[] and setclr[].While color
levels is now fixed to a gradiation series of yellow color, user can choose
arbitrary colors in future.
PARAMETERS :
SEEALSO : fmxmn(),mshplt(),find()
EXAMPLE :
import java.applet.*;
import java.awt.*;
import java.util.Date;
//******************************************
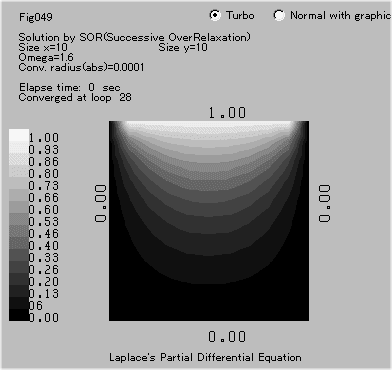
public class Fig049 extends Contour
//******************************************
{
int Imax,Jmax;
int mode_pcon=1;
double Omega;
CheckboxGroup chkbox_group;
Checkbox[] chkboxes;
//==========================================
public Fig049()
//==========================================
{
super(600,500,30.,-5.,-9.);
}
//==========================================
public void init()
//==========================================
{
Integer IX=Integer.valueOf(getParameter("Imax"));
Integer IY=Integer.valueOf(getParameter("Jmax"));
Double Om=Double.valueOf(getParameter("Om"));
Imax=IX.intValue();
Jmax=IY.intValue();
Omega=Om.doubleValue();
chkbox_group = new CheckboxGroup();
chkboxes = new Checkbox[2];
chkboxes[0]= new Checkbox("Turbo",chkbox_group,true);
chkboxes[0].reshape( 350,30, 80, 15 );
add(chkboxes[0]);
chkboxes[1]= new Checkbox("Normal with graphics",chkbox_group,false);
chkboxes[1].reshape( 350,345, 80, 15 );
add(chkboxes[1]);
}
//==========================================
public boolean handleEvent( Event event )
//==========================================
{
if(event.id == Event.ACTION_EVENT)
{
if(event.target==chkboxes[0])mode_pcon=1;
else mode_pcon=0;
repaint();
return true;
}
return super.handleEvent( event );
}
//==========================================
public void paint(Graphics g)
//==========================================
{
double T[][]=new double[20][20],
Buf[][]=new double[20][20],
x2dim[][]=new double[20][20],
y2dim[][]=new double[20][20];
char flg2dim[][]=new char[20][20];
double setlvl[]=new double[21];
int stclr[]=new int[21],stlsy[]=new int[21];
int NLevel=15;
int m=Imax,n=Jmax,f_max=Imax;
int xdim=n+1,ydim=n+1,vdim=f_max+1;
double r=1.e-4,error=1.0;
double North=1.,South=0.,West=0.,East=0.;
int i,j,Loop=0,Iteration;
long Start_time;
// Draw Equation
// g.drawImage(Laplace,110,340,this);
g.drawString("Fig049", 10, 20);
symbol(g,0.,-2.,"Laplace's Partial Differential Equation");
g.drawString("Solution by SOR(Successive OverRelaxation)",
10, 40);
g.drawString("Size x=" + m , 10 , 50 );
g.drawString("Size y=" + n , 150 , 50 );
Date starttime= new Date();
Start_time=starttime.getMinutes()*60+starttime.getSeconds();
g.drawString("Omega="+String.valueOf(Omega), 10, 60);
g.drawString("Conv. radius(abs)="+String.valueOf(r), 10,
70);
number(g,-.2,n/2.,.5,West,90.,2);
number(g,m+1.,n/2.,.5,East,90.,2);
number(g,m/2.,n+.2,.5,North,0.,2);
number(g,m/2.,-1.,.5,South,0.,2);
for(i=0;i<=m;i++)
{
for(j=0;j<=n;j++)
{
x2dim[i][j]=i;
y2dim[i][j]=j;
flg2dim[i][j]='F';
}
}
for(i=0;i<=NLevel;i++)
{
setlvl[i]=(double)i/(double)NLevel;
stclr[i]=i*255/NLevel;
}
SetColorTable(stclr,NLevel);
SetLevelTable(setlvl,NLevel);
Indexdraw(g,-5.,-0.,-4.,9.);
// Boundary setting
for(i=0;i<=m;i++)
{
T[i][0]=Buf[i][0]=South;
T[i][n]=Buf[i][n]=North;
}
for(j=0;j<=n;j++)
{
T[0][j]=Buf[0][j]=West;
T[m][j]=Buf[m][j]=East;
}
// Iteration loop
Loop=0;error=1.0;
while(error>r){
error=0.0;
for(i=1;i<=m-1;i++)
{
for(j=1;j<=n-1;j++)
{
Buf[i][j]=T[i][j]+
Omega*(0.25*(Buf[i-1][j]+Buf[i][j-1]+
T[i+1][j]+T[i][j+1])-T[i][j]);
error+=Math.abs(Buf[i][j]-T[i][j]);
}
}
for(i=1;i<=m-1;i++)
{
for(j=1;j<=n-1;j++)
{
T[i][j]=Buf[i][j];
}
}
Loop++;
if(mode_pcon!=1)
{
ContourSet(g,-1,x2dim,y2dim, T, flg2dim ,m,n);
}
}
Date endtime= new Date();
long elapse=endtime.getMinutes()*60+endtime.getSeconds()-
Start_time;
double Etime=(double)elapse;
g.drawString("Elapse time: "+ Etime +" sec",
10, 90);
g.drawString("Converged at loop " + Loop, 10, 100);
ContourSet(g,1,x2dim,y2dim, T, flg2dim, m,n);
}
//==========================================
public void ContourSet(Graphics g,int mode,
double[][] x,double[][] y,double[][] f,
char[][] flg,
int m,int n)
//==========================================
{
g.setColor(Color.white);
f_rect(g,0.,0.,(double)(m),(double)(n));
g.setColor(Color.lightGray);
mshplt(g, 1,x,y,flg,m,n);
contdraw(g,mode,x, y, f,flg,m,n);
}
//==========================================
void SetColorTable(int[] stclr,int lvl)
//==========================================
{
NPattern=lvl;
for(int i=0;i<=NPattern;i++)
{
ColorPattern[i]=new Color(
stclr[i],stclr[i],stclr[i]);
// stclr[i],127-stclr[i]/2,255-stclr[i]);
}
}
//==========================================
}
DESCRIPTION :
PARAMETERS :
RETURNS :
SEEALSO :
EXAMPLE :