Programming Guide
for Dynamic Figures using Jcalcomp
Sept.16,1997
Ver. 0.90
Hiroshi Sakuta
hsakuta@mit.edu
- Programming in Java
- Dynamic Fugures
- Jcalcomp
- GUI in Java
Contents
1. Design of your Model
- Purpose of your model
Fix your model to represent
- Constructual equations
- Parameters
mathmatical parameters and
specification of the graph
<Example>
- Purpose of your model
Design for dynamic excitation
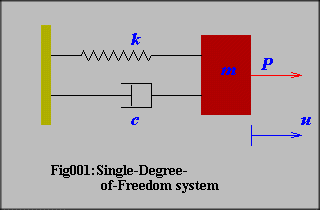
of single-degree-of-freedom 3 componets model

- Constructual equations
 ..................................................
(1.24)
 ........................................(1.25)
 .................................................................(1.26)
 ..........................(1.27)
 ....................................................(1.28)
 .......................................................................(1.29)
 ................................................................(1.30)
 .................................................................(1.31)
 ........................................(1.32)
 ..................................................(1.33)
- Parameters
2. Implement of Mathmatical Formulas
- Fix Variables and their limits in program
- Fix Arrays to be plotted
- Fix the formula
<Example>
- Fix Variables and their limits in program
Rho [0.0
, 2.0]
H1
[0.0 , 5.0]
Xi
[0.0 , 1.0]
- Fix Arrays to be plotted
Maxp=101
Rho[Maxp+3]
H1[Maxp+3]
- Fix the formula
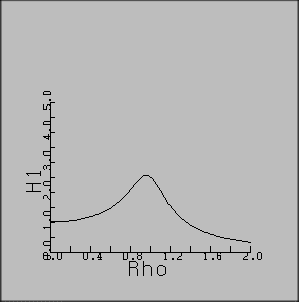
H1[i]=1./Math.sqrt(Math.pow(1.-Rho[i]*Rho[i],2)+Math.pow(2.*Xi*Rho[i],2))
dx
= (2.0-0.0)/(Maxp-1)
3. Jcalcomp
- Apply Jcalcomp class methods
- Window Design
<Example>
- Apply Jcalcomp class methods
super(),axis(),lline(),symbol(),number()
- Window Design
Drawing port
World coordinates 30. x 30. Screen
Coordinates 300 x 300
Origin
(5.,5.)
Lenght of X-axis
20.
length of Y-axis
15.
Title
"Plot of H1 anvs. Rho and Xi"
<CODING >
import java.applet.*;
import java.awt.*;
//******************************************
public class Fig011 extends Jcalcomp
//******************************************
{
//==========================================
public Fig011()
//==========================================
{
super(300,300,30.,-5.,-5.,0,0,300,300);
}
//==========================================
public void paint( Graphics g )
//==========================================
{
double
Rho[]=new double[110],
H1[]=new double[110];
double Xi=0.2;
double Xaxis=20.0,Yaxis=15.;
double Xmax=2.0,Ymax=5.0;
int Maxp=101;
double dx=Xmax/(Maxp-1);
// Calculate the values
for(int i=0;i<Maxp;i++)
{
Rho[i]=dx*i;
H1[i]=1./Math.sqrt(Math.pow(1.-Rho[i]*Rho[i],2)+
Math.pow(2.*Xi*Rho[i],2));
}
Rho[Maxp+1]=0.;Rho[Maxp+2]=Xmax/Xaxis;
H1[Maxp+1]=0.;H1[Maxp+2]=Ymax/Yaxis;
//Draw line
lline(g,0.,0.,Rho,H1,Maxp,0);
// Draw Axis
axis(g,0.,0., Xaxis/10.,Xaxis, 0.,"Rho",3,1,2,0.,.4);
axis(g,0.,0.,-Yaxis/10.,Yaxis,90.,"H1" ,2,1,2,0.,1.);
}
}

4. Insert GUI(Scroll
Bar,Radio Button etc.)
- Allocation of GUI components(Screen coordinates) and Construction of
it
- Event handling
- Related to physical variables
<Example>Figure 011
The differences between source codes with a scroll bar and the example
of 3. are shown in the source code in highlight color.
import java.applet.*;
import java.awt.*;
//******************************************
public class Fig011 extends Jcalcomp
//******************************************
{
Scrollbar Xi_number;
Label Xi_title;
//==========================================
public void init()
//==========================================
{
setLayout( null );
Xi_title = new Label( "Xi"
);
Xi_title.reshape(
10, 20, 40, 20 );
add( Xi_title );
Xi_number = new Scrollbar(
Scrollbar.HORIZONTAL, 50, 0, 0, 150 );
Xi_number.setPageIncrement(
2 );
Xi_number.reshape(
50, 20, 150, 20 );
add( Xi_number );
}
//==========================================
public Fig011()
//==========================================
{
super(300,300,30.,-5.,-5.,0,0,300,300);
}
//==========================================
public boolean handleEvent( Event
event )
//==========================================
{
if (event.id == Event.SCROLL_ABSOLUTE
||
event.id == Event.SCROLL_LINE_DOWN
||
event.id == Event.SCROLL_LINE_UP ||
event.id == Event.SCROLL_PAGE_DOWN ||
event.id == Event.SCROLL_PAGE_UP )
{
repaint();
return true;
}
return super.handleEvent( event );
}
//==========================================
public void paint( Graphics g )
//==========================================
{
double
Rho[]=new double[110],
H1[]=new double[110];
double Xi
= Xi_number.getValue()*.01;
double Xaxis=20.0,Yaxis=15.;
double Xmax=2.0,Ymax=5.0;
int Maxp=101;
double dx=Xmax/(Maxp-1);
// Calculate the values
for(int i=0;i<Maxp;i++)
{
Rho[i]=dx*i;
H1[i]=1./Math.sqrt(Math.pow(1.-Rho[i]*Rho[i],2)+
Math.pow(2.*Xi*Rho[i],2));
}
Rho[Maxp+1]=0.;Rho[Maxp+2]=Xmax/Xaxis;
H1[Maxp+1]=0.;H1[Maxp+2]=Ymax/Yaxis;
//Draw line
lline(g,0.,0.,Rho,H1,Maxp,0);
// Draw Axis
axis(g,0.,0., Xaxis/10.,Xaxis, 0.,"Rho",3,1,2,0.,.4);
axis(g,0.,0.,-Yaxis/10.,Yaxis,90.,"H1" ,2,1,2,0.,1.);
// Draw Xi
g.setColor(Color.red);
symbol(g,5.,Yaxis+1.,"Xi=");
number(g,8.,Yaxis+1.,1.,Xi,0.,2);
}
}
5. Tips
1) Mathmatical representation ( Capturing images in Tex browser
)
At the view point of Mathematical representation, "Tex" and its previewer
are the best in best tools now.
"Tex" was generated by a Mathmatician, Prof. Knuth, and it can cover
every Mathematical formulas and equations. The source codes for viewing
are logical and easy to understand.
In the Web browser, unfortunately, no better formula converter is embedded,
because the real time conversion needs much heavy(huge) browser code.
I reccomend you to apply "Tex" previewing images to Web contents. There
is a conversion program from Latex source codes to HTML, which applies
same method as this. Of course, you can use this for image creation.[See
reference ]
For capturing, Windows has image cutting short cut, which is Fn
+ PrtSc.
After capturing the browsing image or whole screen image, you can paste
it in some image retouch software. You should save each image of
formula as Gif(*.gif) or Jpeg(*.jpg) format after cutting and editting.
In HTML documents, it is easy to insert such a image.
You have to, however, add some source code into your Java source,
if you want to arrange the image in the applet. See next Tip.
2) Insert Bitmasp Iimages
Image data stored in each file of Gif/Jpeg format have to be readfrom the
applet to be represent the image. If you want to use correct formula image
instead of text string, you can alocate it at suitable place.
3) Data input
Java language has stream type input bufferring method, which can allow
input data like numerical data.
See, references.
4) Extend to 3D graph
If you want to extend your model to more free space, 3D modelling is necessary.
If you are not so much interested in presentaion on Web, Excel , GNUPLOT
and other conventional tools can support you to make 3D graphs.
Here, the aim of 3D modelling is to present your own model more
attractive.
3D space in this class library is just corresponding to world coordinate.
There is no 3D user's coordinate.
You have to convert the value of you model to 3D space coordinates.
In many cases, 3D graph is drawn in the isometric projection. This class
library has both of isometric and perspective projection method.
<Example>
1) Mathmatical representation ( Capturing images in Tex browser )
Following Tex source gives the equations from (1.24) to (1.33).
\documentclass[b5paper,fleqn,leqno]{jarticle}
\begin{document}
\[p(t)=\hat{p}\sin \Omega t \\ \]
\[u(t)= \hat{u} \sin (\Omega t - \delta) \\ \]
\[\hat{u}=\frac{\hat{p}}{k}H_1 \\ \]
\[H_1=\frac{1}{\sqrt{[1-\rho^2]^2 + [2 \xi \rho]^2}} \\ \]
\[\tan \delta = \frac{2 \xi \rho}{1- \rho^2} \\ \]
\[\rho=\frac{\Omega}{\omega} \\ \]
\[\omega=\sqrt{\frac{k}{m}} \\ \]
\[\xi=\frac{c}{2 \omega m} \\ \]
\newpage
\[H_1|_{max}=\frac{1}{2 \xi \sqrt{1-\xi^2}} \\ \]
\[\rho_{max}=\sqrt{1-2 \xi^2}\]
\end{document}
2) Insert Bitmasp Iimages
<Example>Fig012
The differences between source codes with a bitmap image and the example
of 3. are shown in the source code in highlight color.

import java.applet.*;
import java.awt.*;
//******************************************
public class Fig012 extends Jcalcomp
//******************************************
{
Image Eq1_27;
//==========================================
public Fig012()
//==========================================
{
super(300,300,30.,-5.,-5.,0,0,300,300);
}
//==========================================
public void init()
//==========================================
{
Eq1_27=getImage(getDocumentBase(),"eq1_27.gif");
}
//==========================================
public void paint( Graphics g )
//==========================================
{
double
Rho[]=new double[110],
H1[]=new double[110];
double Xi = 0.4;
double Xaxis=20.0,Yaxis=15.;
double Xmax=2.0,Ymax=5.0;
int Maxp=101;
double dx=Xmax/(Maxp-1);
setLayout( null );
// Calculate the values
for(int i=0;i<Maxp;i++)
{
Rho[i]=dx*i;
H1[i]=1./Math.sqrt(Math.pow(1.-Rho[i]*Rho[i],2)+
Math.pow(2.*Xi*Rho[i],2));
}
Rho[Maxp+1]=0.;Rho[Maxp+2]=Xmax/Xaxis;
H1[Maxp+1]=0.;H1[Maxp+2]=Ymax/Yaxis;
//Draw line
lline(g,0.,0.,Rho,H1,Maxp,0);
// Draw Axis
axis(g,0.,0., Xaxis/10.,Xaxis, 0.,"Rho",3,1,2,0.,.4);
axis(g,0.,0.,-Yaxis/10.,Yaxis,90.,"H1" ,2,1,2,0.,1.);
// Draw Xi
g.setColor(Color.red);
symbol(g,5.,Yaxis+1.,"Xi=");
number(g,8.,Yaxis+1.,1.,Xi,0.,2);
symbol(g,-5.,-5.,"Fig012");
// Draw Equation
g.drawImage(Eq1_27,0,0,this);
}
}
4) Extend to 3D graph
Two scroll bars are introduced into this graph, which can control the view
point. The conversion tensor of 3D coordinates is formed by the sequence
of rotation around y-axis and that around z-axis. The projection plane
is the world coordinate system on screen, which is like window see through
3D model.
Reference
Manual for Class libraries :
http://web.mit.edu/hsakuta/www/Doc/JCalcomp.html
Samples in Engineering :
http://web.mit.edu/hsakuta/www/Jcalcomp/Sample.html
Technical document in HTML:
http://web.mit.edu/hsakuta/www/Doc/docguide2.htm
How to Create your Home Page in Athena :
http://web.mit.edu/olc-www/www/howto.html
LaTex on Athena
http://web.mit.edu/olh/Latex/index.html
Athena consulting
http://web.mit.edu/olc-www/www/
Latex2HTML
 .................................................................(1.26)
 ..........................(1.27)
 ....................................................(1.28)
 .......................................................................(1.29)
 ................................................................(1.30)
 ........................................(1.32)


