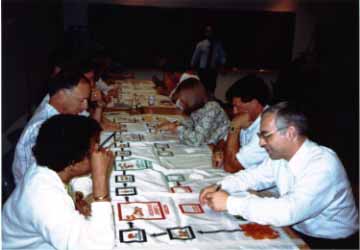
Chaos reigns in my classroom. Eighty students are shouting, gesturing, and laughing while counting poker chips and turning over cards. A thick roll of $1 bills awaits the winners. A field trip to Las Vegas? No, it's the "Beer Game", a role-playing simulation designed to teach principles of management science.
We all know the world is growing more complex. Technological, social, and environmental change are accelerating. Organizations, industries, and government grow ever more tightly coupled. Today's students will face a world that is more dynamic and more uncertain than ever before.
Managers are not alone in facing such daunting tasks. Our society depends on systems of enormous complexity, from nuclear power plants to jumbo jets. Indeed, a popular metaphor likens managers and pilots. Managers must fly their organizations through uncharted skies and rough weather, constantly monitoring their information systems for signs of trouble or opportunity, dogfighting with the competition, preventing hijacking by hostile raiders - all the while giving the stockholders in the back a smooth ride.
There is one difference between managers and pilots, however. No airline would dream of sending pilots up in a real jumbo jet without extensive training in the simulator. Yet managers are expected to fly their organizations relying on management school - the equivalent of ground school - and perhaps some experience as junior crew.
To meet these challenges we need to develop 'management flight simulators', learning environments that motivate, that provide experiential as well as cognitive lessons, that compress time and space so that we may experience the long-term consequences of our actions. The Beer Game is one of a number of management flight simulators developed at MIT's Sloan School of Management for these purposes. The game was developed by Sloan's System Dynamics Group in the early 1960s as part of Jay Forrester's research on industrial dynamics. Its has been played all over the world by thousands of people ranging from high school students to chief executive officers and government officials.
Of course, there is no beer in the beer game, and the game does not promote drinking. Originally the 'production-distribution game', most students are more excited about producing beer than widgets or toasters. When played in, say, high schools, it easily becomes the apple juice game.
Playing the Game
The game is played on a board that portrays the production and distribution of beer (figures 1-2). Each team consists of four sectors: Retailer, Wholesaler, Distributor, and Factory (R, W, D, F) arranged in a linear distribution chain. One or two people manage each sector. Pennies stand for cases of beer. A deck of cards represents customer demand. Each simulated week, customers purchase from the retailer, who ships the beer requested out of inventory. The retailer in turn orders from the wholesaler, who ships the beer requested out of their own inventory. Likewise the wholesaler orders and receives beer from the distributor, who in turn orders and receives beer from the factory, where the beer is brewed. At each stage there are shipping delays and order processing delays. The players' objective is to minimize total team costs. Inventory holding costs are $.50/case/week. Backlog costs are $1.00/case/week, to capture both the lost revenue and the ill will a stockout causes among customers. Costs are assessed at each link of the distribution chain.
The game can be played with anywhere from four to hundreds of people. Each person is asked to bet $1, with the pot going to the team with the lowest total costs, winner take all. The game is initialized in equilibrium. Each inventory contains 12 cases and initial throughput is four cases per week. In the first few weeks of the game the players learn the mechanics of filling orders, recording inventory, etc. During this time customer demand remains constant at four cases per week, and each player is directed to order four cases, maintaining the equilibrium. Beginning with week four the players are allowed to order any quantity they wish, and are told that customer demand may vary; one of their jobs is to forecast demand. Players are told the game will run for 50 simulated weeks, but play is actually halted after 36 weeks to avoid horizon effects.
Each player has good local information but severely limited global information. Players keep records of their inventory, backlog and orders placed with their supplier each week. However, people are directed not to communicate with one another; information is passed through orders and shipments. Customer demand is not known to any of the players in advance. Only the retailers discover customer demand as the game proceeds. The others learn only what their own customer orders.
These information limitations imply that the players are unable to coordinate their decisions or jointly plan strategy, even though the objective of each team is to minimize total costs. As in many real life settings, the global optimization problem must be factored into subproblems distributed throughout the organization.
The game is deceptively simple compared to real life. All you have to do is meet customer demand and order enough from your own supplier to keep your inventory low while avoiding costly backlogs. There are no machine breakdowns or other random events, no labor problems, no capacity limits or financial constraints. Yet the results are shocking.
Typical Results: Boom and Bust
Figure 2 shows actual results from teams consisting of graduate students and business executives. Each column shows the results of a single team. The top four graphs show the orders placed by the players, from the retailer (bottom) to factory (top). The bottom four graphs show the players' inventories and backlogs (negative values), in the same order. Average team costs are about $2000, though it is not uncommon for costs to exceed $10,000; few ever go below $1000. Optimal performance (calculated using only the information actually available to players themselves) is about $200. Average costs are ten times greater than optimal!

More revealing, the departures from optimality are not random. Though individual games differ quantitatively, they always exhibit the same patterns of behavior:
1. Oscillation: Orders and inventories are dominated by large amplitude fluctuations, with an average period of about 20 weeks.
2. Amplification: The amplitude and variance of orders increases steadily from customer to retailer to factory. The peak order rate at the factory is on average more than double the peak order rate at retail.
3. Phase lag: The order rate tends to peak later as one moves from the retailer to the factory.
In virtually all cases, the inventory levels of the retailer decline, followed in sequence by a decline in the inventory of the wholesaler, distributor, and factory. As inventory falls, players tend to increase their orders. Players soon stock out. Backlogs of unfilled orders grow. Faced with rising orders and large backlogs, players dramatically boost the orders they place with their supplier. Eventually, the factory brews and ships this huge quantity of beer, and inventory levels surge. In many cases one can observe a second cycle.
Lessons of the game
During the game emotions run high. Many players report feelings of frustration and helplessness. Many blame their teammates for their problems; occasionally heated arguments break out. After the game I ask the players to sketch their best estimate of the pattern of customer demand, that is, the contents of the customer order deck. Only the retailers have direct knowledge of that demand. The vast majority invariably draw a fluctuating pattern for customer demand, rising from the initial rate of 4 to a peak around 20 cases per week, then plunging.
"After all, it isn't my fault", people tell me, "if a huge surge in demand wiped out my stock and forced me to run a backlog. Then you tricked me - just when the tap began to flow, you made the customers go on the wagon, so I got stuck with all this excess inventory." Blaming the customer for the cycle is plausible. It is psychologically safe. And it is dead wrong. In fact, customer demand begins at four cases per week, then rises to eight cases per week in week five and remains completely constant ever after.
This revelation is often greeted by disbelief. How could the wild oscillations arise when the environment is virtually constant? Since the cycle isn't a consequence of fickle customers, players realize their own actions must have created the cycle. Though each player was free to make their own decisions, the same patterns of behavior emerge in every game, vividly demonstrating the powerful role of the system in shaping our behavior.
Research reported in Sterman (1989) shows how this occurs. Most people do not account well for the impact of their own decisions on their teammates - on the system as a whole. In particular, people have great difficulty appreciating the multiple feedback loops, time delays and nonlinearities in the system, using instead a very simple heuristic to place orders. When customer orders increase unexpectedly, retail inventories fall, since the shipment delays mean deliveries continue for several weeks at the old, lower rate. Faced with a growing backlog, people must order more than demand, often trying to fix the problem quickly by placing huge orders. If there were no time delays, this strategy would work well. But in the game, these large orders stock out the wholesaler. Retailers don't receive the beer they ordered, and grow increasingly anxious as their backlog worsens, leading them to order still more, even though the supply pipe line contains more than enough. Thus the small step in demand from four to eight is amplified and distorted as it is passed to the wholesaler, who reacting in kind, further amplifies the signal as it goes up the chain to the factory. Eventually, of course, the beer is brewed. The players cut orders as inventory builds up, but too late - the beer in the supply line continues to arrive. Inventories always overshoot, peaking at an average of about forty cases.
Faced with what William James called the "bloomin', buzzin' confusion" of events, most people forget they are part of a larger whole. Under pressure, we focus on managing our own piece of the system, trying to keep our own costs low. And when the long-term effects of our short-sighted actions hit home, we blame our customer for ordering erratically, and our supplier for delivering late. Understanding how well intentioned, intelligent people can create an outcome no one expected and no one wants is one of the profound lessons of the game. It is a lesson no lecture can convey.
The patterns of behavior observed in the game - oscillation, amplification, and phase lag - are readily apparent in the real economy (figure 4), from the business cycle to the recent boom and bust in real estate. The persistence of these cycles over decades is a major challenge to educators seeking to teach principles and tools for effective management. Though repeated experience with cycles in the real world should lead to learning and improvement, the duration of the business cycle exceeds the tenure of many managers. In real life the feedback needed to learn is delayed and confounded by change in dozens of other variables. By compressing time and space, and permitting controlled experimentation, management flight simulators can help overcome these impediments to learning from experience.
But the biggest impediments to learning are the mental models through which we construct our understanding of reality. By blaming outside forces we deny ourselves the opportunity to learn - recall that nearly all players conclude their roller coaster ride was caused by fluctuating demand. Focusing on external events leads people to seek better forecasts rather than redesigning the system to be robust in the face of the inevitable forecast errors. The mental models people bring to the understanding of complex dynamics sytematically lead them away from the high leverage point in the system, hindering learning, and reinforcing the belief that we are helpless cogs in an overwhelmingly complex machine.
Thus to be effective, management flight simulators must be more than just business games. They must be embedded in a learning environment that encourages reflection on the perceptions, attributions, and other mental models we use to interpret experience as well as the substantive lessons of the situation. These issues are the focus of current research at MIT and elsewhere (see Sterman and Morecroft 1992 for examples). In addition to growing use in education, management flight simulators, both computer-based and manual, are finding successful application in a wide range of firms. They have helped stimulate improvement in hospital emergency room operations, raised maintenance productivity in the chemicals industry, boosted service quality in the insurance industry, and helped top management in high tech, petrochemicals, and other industries to reformulate their strategies. Though much further work lies ahead, flight simulators may someday be as integral a part of the learning process for managers as they are today for pilots.
Using the Beer Game and Other Management Flight Simulators
The beer game is particularly useful in classes on operations management, production scheduling and related issues. The game highlights the importance of coordination among levels in an organization, the role of information systems in controlling complex systems, and the implications of different production paradigms such as Just-In-Time inventory management.
|
Figure 3. The 'beer game' in real life: The US economy exhibits oscillation, amplification, and phase lag as one moves through the distribution chain from production of consumer goods to intermediate goods to raw materials. |
But the game illustrates more general lessons as well. The game creates a real organization, with 'teams' supposed to work together. Yet the pressures of events and limited mental models of the players quickly cause team cohesion to break down. The game provides a vivid experience with a complex system, where players can see how the collective results of individually sensible decisions can be disastrous; where they can see the connection between the structure of a system and the dynamics it generates. The game is often used by firms in the service, financial, and other industries where there is no inventory to manage. It is widely played as a team building experience at all levels of management from the shop floor to the boardroom.
A full analysis of the beer game appears in J. Sterman (1989), "Modeling Managerial Behavior: Misperceptions of Feedback in a Dynamic Decision Making Experiment", Management Science, 35(3), 321-339. Other management flight simulators and applications to real organizations are described in Modelling for Learning Organizations, John Morecroft and John Sterman, eds., 1994, Portland OR, Productivity Press, 800/394-6868.
Instructions and a video tape of the beer game shown on the MacNeil-Lehrer News Hour in 1989 are available from the System Dynamics Group at MIT. John has also developed a number of additional management flight simulators around other operational and strategic issues. These simulators are computer-based and come with full documentation and instructions:
A version of this paper appeared in OR/MS Today, October 1992, 40-44.