MEA Data Analysis: Information
Theoretic Approach
9.290 Midterm Project Report, Spring
2004
Jake Bouvrie and Michael
Baker
Abstract
Given recordings of neural network
spike activity from a 64 channel microelectrode array, we take an information
theoretic approach towards inferring connections between small sub-networks of
neurons situated within the array. We compare and contrast two distinct methods
for discovering such connections: one in which distributions of pairwise channel arrival times are chosen to satisfy a
minimum entropy criterion, and another in which we quantify and evaluate the
amount of information each node of the array conveys about the others by way of
mutual information maximization. We then discuss the resulting connection
possibilities, as well as the validity of the connection hypotheses, and
finally justify the use of information theory as an attractive alternative to
traditional cross-correlation analysis.
Introduction
The mammalian
nervous system is characterized by a multitude of elements, coupled through
their electrochemical signals. To better
understand this system we wish to begin to answer questions concerning how such
networks of neurons form, how information is represented in such networks, and
how information flows through the network.
Several
techniques have been used for measuring the cellular potential of neurons. The patch-clamp method permits the
exploration of the intracellular potential of an individual neuron. This micro-pipette method has been extended
to make measurements of multiple neurons where the interconnections between
neurons could be determined [7]. Since
this method requires individual micro-pipettes to be positioned, it is not typically
suitable for recording from a large number of neurons. Furthermore, it could be difficult to apply
patch-clamp techniques to the development of new connections among a group of
dissociated neurons.
The
Multi-Electrode Array (MEA) allows an experimentalist to observe the extracellular potential across a relatively large
area. The array used in this work was
1mm x 1mm with 64 electrodes on an 8 x 8 grid.
The large area afforded by the array means the properties of complexes of
many neurons can be studied. Because the
measurements are extracellular, potentials from
several neurons can contribute to the measured potential at any one electrode.
In vitro
observations of dissociated neurons indicate that a new network of neuronal
connections establishes after several days of preparing the culture. The output of the electrodes exhibits
spontaneous firing behavior. Although
the exact properties of this new network can not be completely described by the
activity of the channels, there are several things that can be inferred. First, if connections can be drawn between the
electrodes, some implications concerning the physical distance of connections
can be made. Second, if it can be
established that several channels are causally described by the activity of one
other channel, then we can begin to infer the number of connections made.
We have chosen
to draw these connections and infer causality using information theoretic
methods. Information theory is uniquely
suitable to this task because it combines independence over our choice of
random events with a quantifiable definition of our certainty called entropy.
Prior Work
The
use of information theory as a tool for analyzing neuronal data is nothing new.
Several authors [2,3] have applied information
maximization in the context of blind source separation, where spike activity
from several neurons has been recorded simultaneously and must be separated (or
“sorted”) into spikes specific to each neuron on the basis of unique spike
signatures. Other investigators [1,4,5] have
calculated the mutual information between a known stimulus and the
corresponding neuron responses in order to determine the rate of information
transfer, while Chechik [6] has investigated
communication between a group of neurons firing into a single destination
neuron and examined the corresponding information transfer properties of such a
configuration.
Our
approach however, represents a departure from much of the established work.
Because spike data recorded from a given MEA electrode can possibly include
spikes from an unknown quantity of neurons, we cannot match specific spikes to
specific pre/post synaptic neurons with known spatial locations. Many of the
above papers made use of patch-clamp data recordings where the investigators
were sure as to the source and destination of each spike. In addition, our MEA
spike data does not represent a response to a known applied stimulus, making it
impossible to compute information transfer rates or symbol efficiencies. We
therefore stress that our results must be interpreted with some degree of
flexibility; they are not “hard truths” but high-probability suggestions, and
the presented analysis is truly “exploratory” in nature.
Spike Extraction from
Noisy Data: Methods
Examining the
distribution of voltages that are present in the noisy signal we can determine
several properties that are relevant to extracting spike symbols.
Noise Properties
Figure 1 shows a
representative histogram of the noise from a channel. Note that the
approximate histogram shape appears to be Gaussian, fitting with our
expectation of the binomial distribution of noise arising from shot
processes.
Figure 1: A plot of the histogram of voltages
on channel 1 for bic1_file1. Note the
Gaussian fit with σ = 0.003 V.
Knowing a rough
distribution for the noise can assist us in determining a reasonable threshold
above which data points are likely not associated with noise.
Spike Properties
A number of distinct
spike shapes are expected in an MEA array – corresponding to several different
locations on the spiking neurons [8]. Examining
the channels we observe many common spike shapes. Figure 2 shows 5 representative spikes from
our data overlaid to show their general similarities.
Figure 2: Spike shapes overlaid to show
similarities. The x-axis is samples of
50us. Peak amplitudes have been
normalized to 1.
As we will show
in the next section, knowing the shape of the spikes is useful in detecting
spikes.
Detecting
Signals in Noise
Consider the
case of a periodic signal such as a sinusoid in noise which we wish to
detect. An easy way to automate detection is to employ a comparator which
is sensitive to a voltage level. Since a sinusoid is not a constant
voltage level, we can convert it to a constant voltage level by multiplying our
noisy signal, xn(t), with our detector signal, s(t), we can extract a
constant component,
If we filter out
the high-frequency components, we are left with a constant voltage level, ![]() . This approach is
used for both analog and digital radio receivers with amplitude modulation
schemes. Not surprisingly, this receiver
principle is also applied to finding non-periodic signals in noise by finding a
matching filter.
. This approach is
used for both analog and digital radio receivers with amplitude modulation
schemes. Not surprisingly, this receiver
principle is also applied to finding non-periodic signals in noise by finding a
matching filter.
The matching
filter is a time-series that is convolved with the input signal to produce a
maximum output in the event of a symbol event.
It is possible to show that for a given symbol sequence, x[n], the
maximizing filter for convolution is also, x[n]. We can compute an estimate of x[n] by
computing a representative spike shape. Figure
3 shows the filter used for this purpose.
Figure 3: A representative spike shape used
as a maximal filter, x[n].
Spike Extraction from
Noisy Data: Results
We have no a
priori information about the probability distribution of spikes in our data. We do, however, have some knowledge about the
nature of the noise in our system and its statistics.
Note the operation
of the maximal filter on the data preserves the Gaussian character of the
noise. Because the convolution takes a
sum of random variables, the output at any sample is also a random
variable. The distribution mean has
changed, however, because the sum of the weights in the maximal filter is not
zero.
To extract the
spike events, we can look at the peak levels in the data channel and determine
the membership in either the spike distribution or the noise distribution. Figure 4 shows the chosen threshold from the
distribution fitting to noise and spikes.
The vertical blue line indicates the threshold at which the
distributions are indistinguishable, corresponding to the maximum a posteriori
probability of deciding correctly between membership
in either set.
Figure 4: A histogram of extracted peak
amplitudes is plotted after the maximal filter is applied. Note the Gaussian noise is integrated by the
filter and remains Gaussian. A threshold, shown as a vertical line, is used to distinguish two
distributions.
Determining Causal
Relationships: Methods
Causal
relationships among channels can help us understand the emergent neural network
in several ways. First, it indicates the
possibility of connection between groups of neurons and the distances in the
array over which this occurs. Second,
causal relationships can be useful as indications of hidden sources of
excitation which are represented in a common way across the electrodes.
Measuring
channel-wise entropy is an appropriate way to obtain this because it captures
our overall certainty about the presence of a particular condition. It is most important, however, that the
condition which we are seeking to identify is clearly represented in our choice
of random variables.
The chosen
variable must capture the common timing information between channels. The chosen variable for this work is shown in
Figure 5. Consider the arrival time of a
spike on channel j, after a spike on
channel i
is observed. If we have certainty over
the arrival time, we have a possible causal connection.

Figure 5: Random variable, X, shown as the arrival time
on some channel j after a spike on channel i.
Estimating the
distribution in each case was hampered by the lack of extensive data on some
channels. As a result we experimented
with approximation methods for a smoother distribution. Ultimately, we discarded event times that
were unlikely and we binned the distributions into 32 bins. We then computed the entropy of all the
pair-wise channel distributions.
The measure of
entropy is given by,
 .
.
For a
distribution P(X), where a particular outcome in AX is almost
assured, we have a very low H(X). Similarly,
distributions where P(X) is roughly even for all AX will have high entropy. The entropy is measured in bits,
where each bit can be thought of as the result of a fair coin flip [3].
We computed this
random variable for all channels, and sorted the output to find strongest
causal connections following the rule,
![]() .
.
If we define a connection only between channels where we have less than 1
bit of entropy for this measure C(z), we are choosing
connections where more often than not, the pattern of activity on the target
channel is a delayed version of the activity on the source channel. Thus, we can infer how information is moving
across the set of electrodes for the duration of our experiment.
Determining Causal
Relationships: Results
The sorted
outcomes for the channels exhibited some expected properties. First, we noticed no connections stronger
than about 0.6 bits. This means that under
most conditions we do not have complete certainty over the causal relationships
between the data. There are notable
exceptions to this, however, where some channels exhibited almost concomitant
firing behavior during some periods.
Figure 6 shows an example of this behavior for two channels.
Figure 6: Channels where firing occurred
almost concomitantly.
The remaining
connections which were stronger (less than) 2 bits are shown in a directed,
weighted graph, Figure 7. Note that there
are several super-nodes (27, 62, 57) which appear
causally related to several other nodes.
Underlying these may be connections which are exciting activity across
the network. Further, there are other
nodes (49, 64) which appear to be causally related to more than one of these
super-nodes.
Figure 7: A directed graph showing the results
of the entropy minimization.
It is worth
noting that long-range connections have been established between nodes spanning
a distance of approximately 1 mm.
Measuring Mutual
Information: Methods
As
a second approach to uncovering connectivity within the array, we investigated a
form of mutual information between pairs of electrodes. Before describing this
approach, we first offer a brief explanation of mutual information, and its
applicability to MEA data.
Generally
speaking, mutual information quantifies the information one random variable
tells us about another. Seen in the context of array data, we can describe
mutual information as measuring the reduction in uncertainty for one channel we
gain given our knowledge about another channel’s activity. Thus for two random
variables X and Y, we can write the mutual information I between the two in
terms of the conditional entropy:
![]()
with
I(X;Y) = I(Y;X) and I(X;Y) non-negative, and where we define H(X|Y) as
![]() .
.
In
a significant fraction of the literature concerning the application of
information theory to neural spike data, mutual information is computed between
a known stimulus and the corresponding neuronal response (see for example, [1]).
In an attempt to cast our exploratory data analysis problem within this
framework, we consider as the “stimulus” spike activity found on one given MEA channel,
and as the “response”, spike activity on another. Taking all possible pairs of
channels, we compute the resulting mutual information and extract possible
connections under the assumption that spikes from groups of neurons under one
electrode might cause (or at least contribute to) spiking at another.
More
formally, we first define the “distribution” Pi(Y) to be the probability of a spike occurring in
channel i at time Y=t, computed as the spike triggered
average over a Gaussian time window (here chosen to be 40ms.). An example of
such an average is shown for channel 26 of the MEA array in Figure 8.
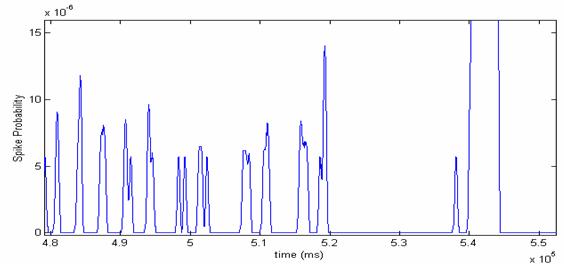
Figure 8: Probability Pi(Y=t) of
spiking over a range of times t in
milliseconds.
Next,
we define the distribution Pj(X)
to be the probability of seeing the spike interval time X=x (ms) in channel j as
illustrated in Figure 9. These distributions of spike arrival times for each channel
look strikingly Poisson, however we create the distributions by computing a
histogram of observed times from the spike data, and do not assume any
particular parametric form.
![]()
Figure 9: Spike arrival times for a given
channel j are
collected to form the distribution Pj(X).
Lastly,
we define the conditional distribution Pij(X|Y) to encode the probability that a spike in
channel j occurs X=x milliseconds after a spike Y at time t in channel i. Note that this is the same distribution defined in the previous
approach for each pairwise channel random variable Xij, although we now reinterpret the reference spike as a
conditional stimulus. In practice, as with the previous distributions, we
computed estimates based on histograms of observed timing from the recorded
data.
Given
the above definitions, we may now build a joint distribution over “reference”
spikes in one channel and the presumed resulting spikes in another by taking
the product of the conditional distribution and spike probabilities:
![]() .
.
Rather
than compute this joint distribution explicitly however, we simply use the
above definition of conditional entropy to arrive at the mutual information
calculation

Given
Iij for all i and j (which range over the channels of the array), we may now infer
connectivity by choosing the connection C(z) for a node z as the node which conveys the maximum amount of information about
z:
![]()
The
Iiz
(over all i)
may also be thresholded according to a knee pattern
(if present) or some descriptive statistics, in order to decide whether a
connection is present or not. Alternatively, one might assume that multiple
connections are physically likely, and interpret the mutual information
quantities as a sort of confidence in each prospective connection.
Finally,
it should be noted that the above mutual information calculation is not,
strictly speaking, mutual information since it is not always the case that Iij(X;Y)
= Iij(Y;X). Because the
“distribution” P(Y) represents the instantaneous probability of seeing a spike
in a particular channel, we average over all time to obtain the final
information quantity and we cannot simply “swap” P(X) with P(Y). Similarly, it
is not always the case that Iij(X;Y) = Iji(X;Y)
since different channels might have different arrival time distributions. In
practice, the fact that Iij(X;Y) does not exactly equal Iij(Y;X) can be overlooked, and we force the matrix I of pairwise
information with entries (I)ij to
be symmetric in order to make the computation a “true” mutual information.
Measuring Mutual
Information: Results
In
order to ensure that the various distributions above would be estimated
accurately, we chose to consider only those channels with more than 40 recorded
spikes, and collected only biologically plausible spike interval times between
5ms. and 15ms. We found that it is important to enforce realistic constraints
on the time intervals used to build the various distributions in order to
prevent spurious timing themes from overpowering other timing patterns,
resulting in false connections (e.g. all nodes connect to the same other node).
In addition, confining the analysis to the above time window restricts the
connections to those that are direct, and does not consider connections which
travel through one or more intermediate neurons. A symmetric color-coded matrix
(I) ij of mutual
information calculations from the bic1
dataset is shown in Figure 10, where red represents high mutual information,
and blue low mutual information. The diagonal entries have all been set to zero
(dark blue) to enforce the notion that a variable cannot reduce the uncertainty
of itself.
Figure 10: For each channel (row), the
mutual information with each of the other channels (columns) is shown with red
corresponding to higher mutual information, and blue low mutual information.
The specific array channels (with more than 40 spikes) are denoted on the left.
Given
such a matrix, the single strongest connection for each node was identified
according to the procedure described under Methods
above. In Figure 11, we show a handful of the strongest of these best
connections amongst array electrodes, and note that some of the connections
found in the first (Entropy minimization) approach are re-discovered using the
mutual information framework, although directedness of the graph has been lost
due to the symmetry of mutual information.
Figure 11: A subset of the strongest
connections is shown. Line thickness denotes relative strength, and we note
that some of the connections were also found using the first approach.
Conclusion &
Caveats
This
project has shown two possible ways of analyzing multi-electrode array spike
data within an information theoretic framework. We firstly proposed to examine
distributions of spike arrival times across pairs of MEA channels, and
uncovered network connectivity by looking for coherent interspike timing themes
in the distributions of pairwise arrival times. The most convincing timing
patterns were identified by choosing, for each channel, the distribution with
minimum entropy. Our second approach quantified the amount of information each
node in the array conveyed about each of the others (in the form of mutual
information), given distributions of pairwise arrival times, single channel
arrival times, and single channel spike probabilities. The results of both
methods were then used to propose connections between sub-networks of neurons
in the array, giving directed and undirected graphs in the first and second
approaches respectively.
While
both methods uncovered likely connections between each node, they clearly do
not discover all connections, and at times identify possibly spurious
ones. This is due in part to the fact that there might be multiple neurons
beneath a given node, which makes it impossible to clearly identify pre- and
post-synaptic neurons. In addition, it is possible that some of the observed
spike activity might be due to internal sub-network communication, and is not
at all related to external sub-networks. Lastly, intermediate neurons cannot be
identified from the spike timing, and it could be the case that spikes are
traveling through multiple neurons rather than along direct paths, while others
may be entirely lost in situations where the post-synaptic neuron does not read
enough inputs to itself fire in response. We also entirely ignore possible
inhibitory effects.
As
an added complication, the neurons from which the spike data was recorded were
not firing in direct response to a known stimulus. Thus, we have no time
reference for activity, and no “ground truth” with which to compare our
conclusions, other than physical (im)plausibility. Furthermore, the bic spike promotion chemical causes
flurries of simultaneous spiking shortly after its application, and it is not
clear when real cause/effect “communication” begins. Without bic however,
spontaneous spiking data over anything but very long time periods would be too
sparse to accurately estimate the required distributions.
Despite
these difficulties, the information theoretic approaches outlined in this
project can surely at least shed some light on the organization of a cultured
neural network. It is also worth noting that information theory can provide a
viable alternative to, and explanation for, traditional correlation analysis.
Explaining relationships between networks of neurons in terms of bits of
information can be more compelling than finding and comparing peaks in hundreds
of cross-correlation plots. In the case of binary data vectors,
cross-correlations are also somewhat unreliable due to the fact that, in order
to detect coherent patterns, spikes must line up exactly. If the sampling rate is high, this is very unlikely to
happen when it ought to, and many patterns might be lost. Estimating
distributions of spike times on the other hand, provides some flexibility or
“fuzziness” in the search for timing themes. If a prominent spiking pattern is
in the data, then a distribution of arrival times ought to have comparably low
entropy. We therefore argue that a probabilistic/information theoretic approach
would in most cases be preferable to correlation analysis.
References
[1] P. Dayan & L.F. Abbott, Theoretical
[2] Amari,
S., Chichocki, A. and Yang, H. H., ``A New
Learning Algorithm for Blind Signal Separation,'' Laboratory for
Information Representation, FRP, RIKEN, Wako-shi,
[3]
[4] C.J. Rozell and D.H. Johnson. Examining methods for estimating
mutual information in spiking neural systems. In Annual Computational
Neuroscience Meeting,
[5] C.J. Rozell, D.H. Johnson, and R.M. Glantz. Measuring information transfer in
crayfish sustaining fiber spike generators. Biological Cybernetics,
90(2):89-97, February 2004.
[6] G. Chechik, Spike-Timing-Dependent Plasticity and Relevant
Mutual Information Maximization.
Neural Computation, 15, 1481-1510, 2003.
[7] M. Alreja, G.
K. Aghajanian, Use of the whole-cell patch-clam
method in studies on the role of cAMP in regulating
the spontaneous firing of locus coeruleus neurons. Journal
of Neuroscience Methods, 59 (1995): 67-75.
[8] E. Claverol-Tinture,
J. Pine, Extracellular potentials in low-density dissociated neuronal
cultures, Journal of Neuroscience Methods, 117 (2002): 13-21.
Division of Labor
Joint
Work: - Conceptual design of methods for entropy analysis and
mutual information analysis.
-
Progress presentations (see hebb.mit.edu/people/neville/mea)
Jake Bouvrie: - Mutual Information Analysis
Code
-
Entropy Analysis Code & Entropy Ranking Figures
Michael
Baker: - Maximum Aposteriori Decoder Code
-
Directed Graph Code for MI and Entropy matrices
Writeup:
- Abstract - Jake
- Introduction – Mike
- Prior Work – Jake
- Spike Extraction from
Noisy Data Methods & Results – Mike
- Determining Causal
Relationships Methods & Results – Mike
- Measuring Mutual Information
Methods & Results – Jake
- Conclusion & Caveats
- Jake