We present a comparison between the plasma properties of accreting Classical T-Tauri Stars (CTTS) and the coronal Main Sequence (MS) stars seen with Chandra/HETG and the characteristics of their TESS lightcurves. Our analysis reveals that the temperature diagnostics (provided by (i) the ratio of H-like to He-like X-ray emission of Si, Mg, Ne, O versus individual line luminosities, and (ii) ratio of H-like to He-like X-ray emission of each line plotted against the ratio of H-like to He-like of another) both exhibit a positive correlation. Interesting, these correlations are independent of the stars' flaring activity during their X-ray or optical observations. This is contrary to our expectation that X-ray flares should cause increased plasma temperature and demonstrate a need for detailed flare characterization in optical and X-rays. We are continuing our study to correlate the flaring behaviour of these stars against their fundamental properties (e.g., rotation periods, mass, age, abundance).
Young stars exhibit stellar flares caused by explosive magnetic reconnection in the star's magnetosphere and while most of them are in X-rays, very energetic ones are also seen in optical wavelengths. We have explored the TESS archive to characterize the flare activity seen in the TESS lightcurves and compared the optical activity of these stars against their X-ray flaring characteristics with Chandra. Coronal emission from some of these stars is believed to be driven by the stellar magnetic dynamo, which in turn is caused by differential rotation in the stellar interior. Thus, the relationship between these young stars' flaring activity and rotation periods is crucial for understanding their physical characteristics. Given that TESS mostly detects bright stars, which overlap with the sample observed with HETG, unlike previous missions (e.g. Kepler), these studies explore larger parameter space than before.
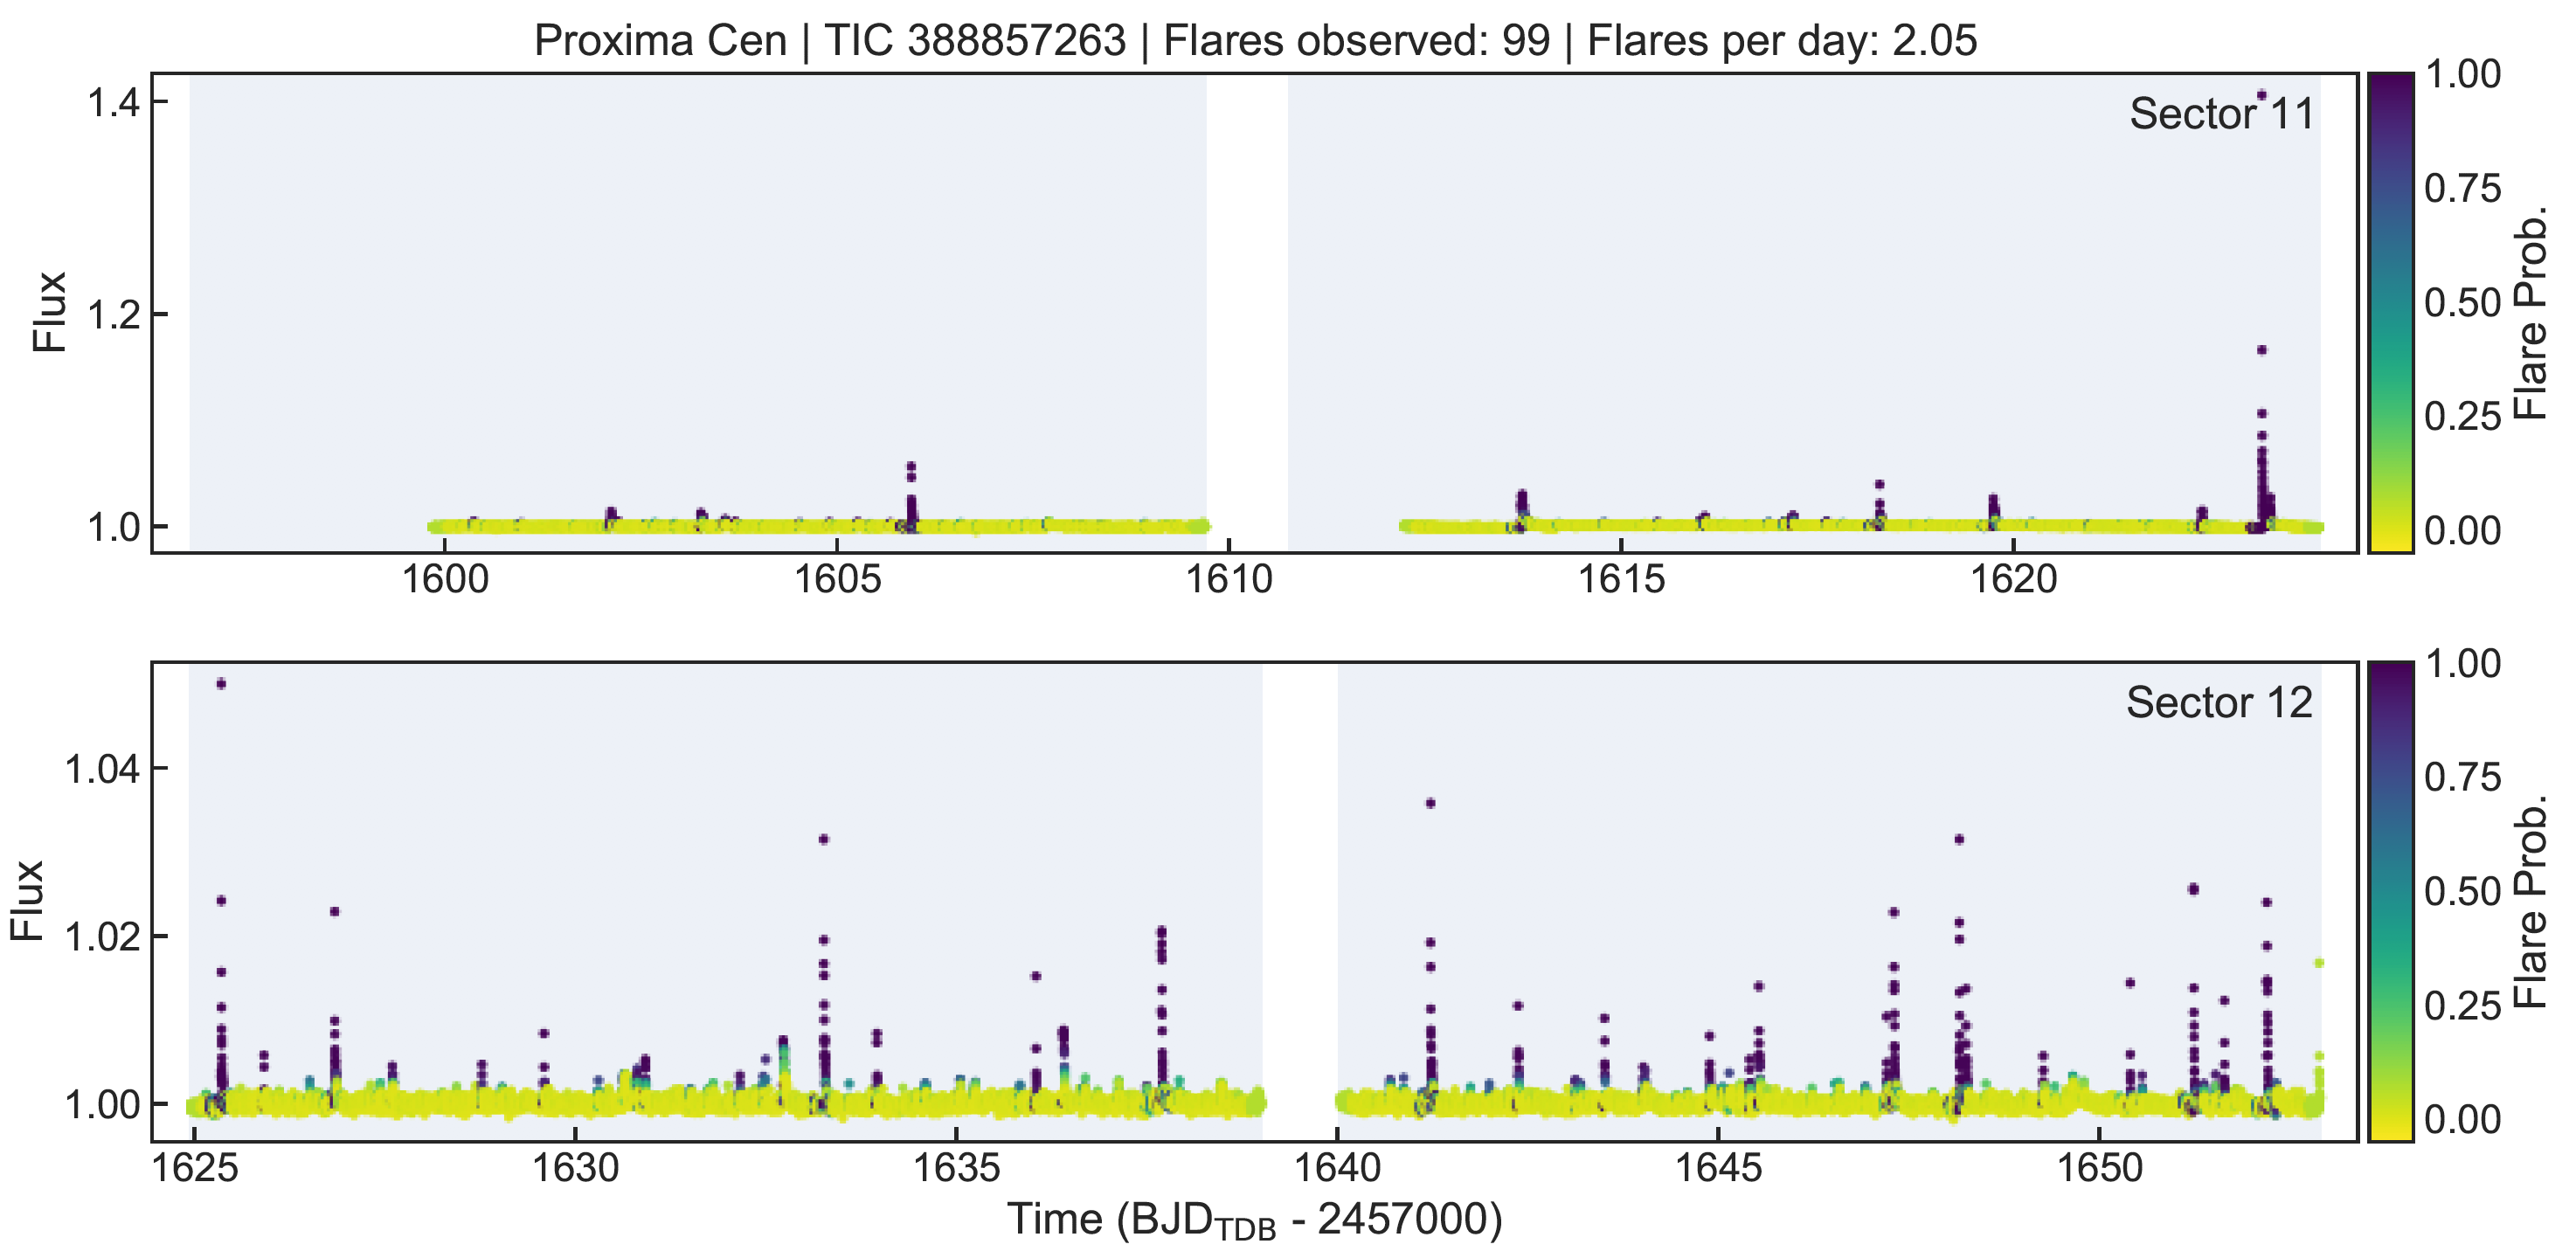
We made a list of all cool stars seen with Chandra/HETG and extracted their X-ray lightcurves and high resolution X-ray spectrum. We then fit the continuum of these stars with a 3T plasma model. Individual lines were fit parametrically by assuming a Gaussian shape to each line. Moreover, we searched the full TESS year 1&2 data for optical flares and characterized the flare activity seen in the lightcurves (Günther et al. 2020 and in prep.), utilizing the `stella' neural network (Feinstein et al. 2020) along with human vetting and quality control filters to minimize false positives.
We find that the behaviour of X-ray emission line ratios versus flux is similar whether the star was persistent or flaring during the observation. This indicates that although flares are expected to increase the overall temperature (measured by H-like to He-like X-ray emission line ratios) in the star, the subsequent increase in luminosity causes the two states of the stars to be indistinguishable. We plan to correlate this flaring behaviour with other physical properties of the stars. Of special interest are stars that are outliers in the trend plots, which we are closely studying. We also include more stars in our study by extracting the XMM/RGS spectrum to expand our sample space to more stars at longer wavelengths.
