Tools for analysing and visualizing Networks
• Softwares and tools for analysing and Visualizing Networks
• Agna
• CATEGORIE1 : To map
CATEGORIE2 : Tools for analysing and Visualizing Networks
CATEGORIE3 :
TITLE : Agna
SUBTITLE : A platform-independent freeware application
SOURCE: Marius I. Benta
TYPE : software
URL : http://www.geocities.com/imbenta/agna/index.htm
STATUS : Freeware application, free to use and distribute
DIFFICULTY: Need SNA knowledge
COMPATIBILTY: your computer should supports Java applications
RATE: unrated
DESCRIPTION: Agna , from Marius I. Benta. Applied Graph & Network Analysis is a platform-independent freeware application designed for those scientists and researchers who employ specific mathematical treatment of data, such as social network analysis, sociometry or sequential analysis. (28th March, 2003: version 2.0.3) Download it at http://www.freewebz.com/benta/agna/download.htm . Agna features platform independent, friendly and easy to learn, integrated visual editor, html output. Agna deals with social networks in an intuitive manner, and this makes it ideal for understanding SNA concepts. Networks can be edited and transformed using two basic tools: a spreadsheet and a visual network editor.
IMAGE :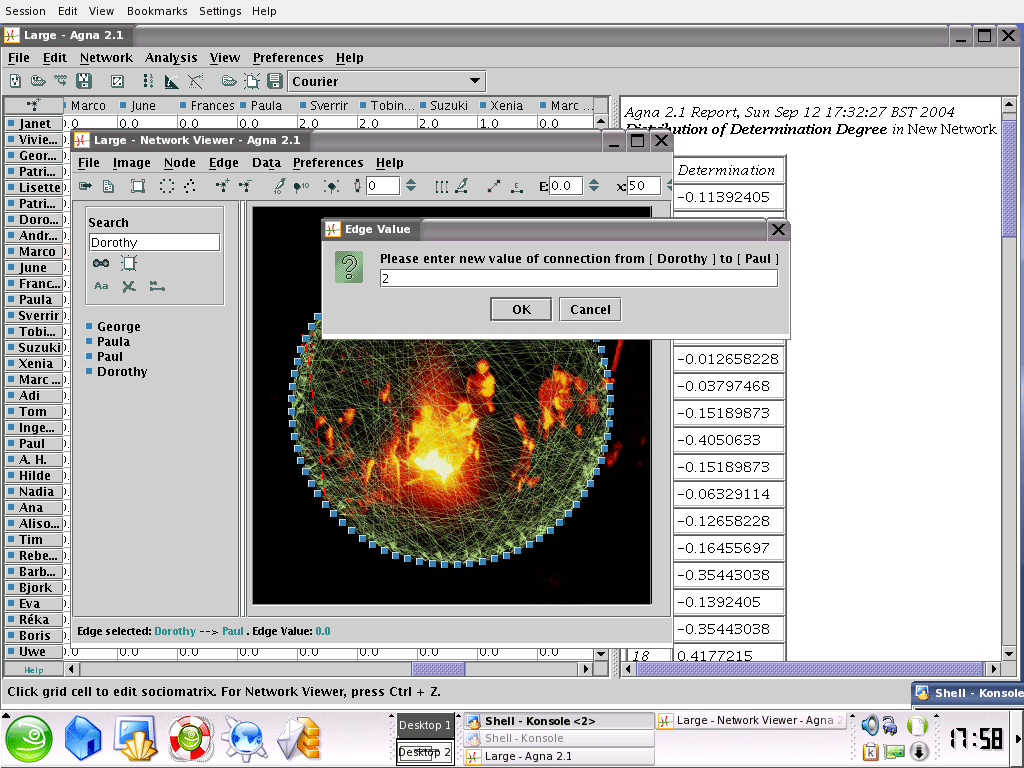
TAGS : Program - software - Networks analysis - sociometry - sequential analysis- freeware
• Anthropac
• http://www.analytictech.com/anthropac/apacdesc.htm
Category : Program for analysing Networks
Source : Analytic Technologies
status : The program costs $75 for professionals and $30 for students. Site licenses are also available.
difficulty :
Compatibility : this cultural domain analysis software does not run on fast machines.
summary :ANTHROPAC is a menu-driven DOS program for collecting and analyzing data on cultural domains. The program helps collect and analyze structured qualitative and quantitative data including freelists, pilesorts, triads, paired comparisons, and ratings. ANTHROPAC's analytical tools include techniques that are unique to Anthropology, such as consensus analysis, as well as standard multivariate tools such as multiple regression, factor analysis, cluster analysis, multidimensional scaling and correspondence analysis. In addition, the program provides a wide variety of data manipulation and transformation tools, plus a full-featured matrix algebra language.
ANTHROPAC is accompanied by a 150-page Reference Manual, a 60-page User's Guide, and a 40-page Methods Guide (which provides basic background information on the methods of cultural domain analysis). These manuals are provided in electronic form, not paper.
• Automap
• http://www.casos.cs.cmu.edu/projects/automap/index.html
AutoMap uses parts of speech tagging and proximity analysis to do computer-assisted Network Text Analysis (NTA). NTA encodes the links among words in a text and constructs a network of the linked words.
AutoMap uses parts of speech tagging and proximity analysis to do computer-assisted Network Text Analysis (NTA). NTA encodes the links among words in a text and constructs a network of the linked words.
• BioLayout Express 3D
• http://www.sanger.ac.uk/Teams/Team101/biolayout/b3d.html
Author(s):
Anton Enright, Leon Goldovsky, Ildefonso Cases, Markus Brosch and Tom Freeman
Institution:
Genome Research Ltd.
Year:
2006
URL:
http://www.sanger.ac.uk/Teams/Team101/biolayout/b3d.html
Project Description:
BioLayout Express 3D is a Java platform for layout, visualization and clustering of large Graphs in 3D and 2D. The application is based on the original BioLayout 2D with significant changes to both layout and rendering. The express version has been designed to add functionality for the generation of graphs from large-scale gene expression studies such as Affymetrix chip experiments. In principle this functionality can be used to generate graphs of other data types whose input consists of unique nodes accompanied by a vector of measurements for that node across different conditions. In the case of Affymetrix data, nodes represent probesets and the vector consists of normalised expression measurements for each probeset across the conditions tested.
• Commetrix ***
• http://www.commetrix.de/
Commetrix is a Dynamic Network Visualization and Analysis Software that supports Community Moderators, Members, and Network Researchers. It provides an easy exploratory yet comprehensive access to network data and allows for:
• Extracting virtual communities in electronic communication networks
• Visualizing dynamic network lifecycles, properties, and structures
• Creating rich expert network maps from communication logs
• Searching, filtering, navigating social corpora, like e-mail, discussions
• Understanding and utilizing your social networks
• Trace dissemination of topics or properties through the network
• Extendable to all sources of network data
• Dynet
• Link :http://www.atalab.com/software/dynet/index.php
Category : Program for analysing Networks
Source : ATALAB, Advanced Technology Assessment http://www.atalab.com/company/ata_contacts.php
Status : Commercial Product
Difficulty :The graphic interface is simple and extremely intuitive together with advanced options to customise generated networks in terms of the desired indicator or relevant filter.
Compatibility : DyNet can upload any type of database (tab delimited-spread sheet or SQL) and so far it has been used also to analyse biological and chemical databases, financial information, management data, defence data.
Summary :ublications, patents, diseases, chemicals, people, locations but also day-to-day data such as: web portals, supply chains, financials, customer data, e-mails, companies, human resources, etc. DyNet implements social network theory to elucidate at a glance interconnections and relationships among selected data and their associated strengths, significance, embeddedness plus a strong feature such as dynamical changes through time to unveil trends and positioning of competitors. DyNet can be used, in science knowledge bases, to check for therapeutic areas or drug targets and their evolution in time in terms of publications, key scientists involved and their relationships, competitors, patents (forward citations), chemicals, NCEs and many more. DyNet (figures ) will display data in terms of NODES (subject of your data: people, companies, shares, products, publications, patents) with LINKS to other nodes to which a connection has been established in the data set. Links thickness will generally determine the strength of that relationships whilst node size generally reflects the importance of that node within the network. Complex networks can be filtered according to attributes or other values loaded with the dataset together with colour editing in order to group or highlight relevant nodes.
• Ecosystem Network Analysis
• http://www.cbl.umces.edu/~ulan/ntwk/network.html
Category : Program for analysing Networks
Source :
Status :
Difficulty :Need SNA knowledge
Summary :In tracing the trophic connections among the populations of even the simplest ecosystems, the emerging picture soon comes to resemble a hopeless jumble, sometimes referred to as a "bird's nest" or "spaghetti" diagram. Yet within such a depiction lie valuable clues to how the ecosystem is functioning. "Ecosystem network analysis" is the rubric applied to a collection of quantitative methods that systematically teases most pertinent information from the full, complicated network description.
• EgoNet
• http://survey.bebr.ufl.edu/EgoNet/
Category : Program for analysing Networks
Source : Christopher McCarty, UF Survey Research Center
Status : Free to use
Difficulty :Need SNA knowledge
Compatibility : Java programs and requires that Java be installed on each station that the program is used on.
Summary :Egonet is a program for the collection and analysis of egocentric network data. If you are new to ego-centered networks please read over the Introduction to Ego-centered networks page (link to the Introduction to Ego-centered Networks). This software will assist you in creating the questionnaire, collecting the data and providing general global network measures and data matrixes that can be used in further analysis by other software programs.
• Fatcat
• Link : http://www.sfu.ca/%7Erichards/Pages/fatcat.htm
Category : Program for analysing Networks
Source : Bill Richard
Status : Free
Difficulty :Need SNA knowledge
Compatibility : It can print to PostScript (color) or Epson-compatible dot-matrix printers. In Windows you can use the clipboard to insert graphical results into your favorite word processor. FATCAT can deal with networks having up to 32,000 nodes, 50 variables, and an almost unlimited number of links.
Summary :A different kind of network analysis program. FATCAT works with categorical who-to-whom matrices, in which you select a variable that describes nodes to determine the categories for rows (who) and another one to determine the categories for columns (whom). FATCAT uses two files of data at once -- the "Index" file describes nodes and the "Link" file describes links between pairs of nodes. The program is interactive and menu-driven, it provides context-sensitive on-line help. The latest version (4.2, September 1993) uses an intelligent graphics routine to make graphic representations of two-dimensional crosstabulation tables, called "panigrams", which make the information contained in the rows and columns of numbers and percentages immediately evident at a quick glance. Documentation is on-line.
• Fidg't Visualizer
• Author(s):
(unknown)
Institution:
Fidg't
Year:
2007
URL:
http://www.fidgt.com/visualize
Project Description:
Fidg't works as a Social Networking Address Book by keeping track of all your friends and their media across different social networks. After signing up you can just enter a couple of your accounts and Fidg't pulls all of your friends together and group them into what they call Meta Contacts. Some supported social networks include Flickr, LastFM, AIM and Yahoo Messenger. One of the coolest services provided by Fidg't is a desktop application called Fidg't Visualizer.
The Fidg't Visualizer allows you to play around with your network through Flickr and LastFM tags, using any tag to create a magnet. Once a tag magnet is created, members of the network will gravitate towards it if they have photos or music with that same tag.
This simple mechanic lets you visualize your network in a unique way, demonstrating its predisposition towards certain things. What is more popular amongst people in your network - rock or electronic music? Are photos of buildings more popular than photos of sunsets? Based on how your network reacts to those tags, you might get an answer. The Visualizer also shows how your network compares to a random sampling of the networks of other Fidg't users, letting you see how your network stacks up to others. For good measure, you can also search through the network for certain users, and check out their recent photos and music.
• Graphplot
• http://coral.wcupa.edu/sociometry/
Category : Program for analysing Networks
Source : treadwell /ttreadwell@wcupa.edu
Status :GraphPlot is Password Protected - Send E-mail to ttreadwell@wcupa.edu to obtain permission.
Difficulty :Need SNA knowledge
Summary : GraphPlot is a spreadsheet and a drawing tool for sociometric data that has been designed to handle unlimited numbers of individuals and objects. As in commerical designing, it draws sets of shapes (nodes) that are arranged spatially, with lines (edges) connecting them "on the dime" to other shapes. As data are entered a sociogram emerges connecting lines from subject to subject illustrating the communication network.The shapes represent people and significant objects from the real world, and the lines represent relationships between the shapes. GraphPlot allows you to edit graphs interactively in an intuitive manner. It works much like a drawing program. As you add data to the database, GraphPlot re-arranges shapes (circles, trianges, etc.,) automatically so shapes are connected by lines that are in close proximity. This is significant in organizing an effective sociogram to help the viewer percieve the relationships within the communication network. Shapes representing 'closer' relationships are placed near one another, while those that are 'distant' are arranged further apart.
• GraphViz
• http://www.graphviz.org/
Category : Graph Visualization software / Program for Social Network analysis
Source : AT&T Research
Status : Open source
Difficulty :Need SNA knowledge
compatibility : Mac OS X edition of Graphviz : http://www.pixelglow.com/graphviz/
Summary :Graph visualization is a way of representing structural information as diagrams of abstract graphs and networks. Automatic graph drawing has many important applications in software engineering, database and web design, networking, and in visual interfaces for many other domains. It has several main graph layout programs. See the gallery (http://www.graphviz.org/Gallery.php ) for some sample layouts. It also has web and interactive graphical interfaces, and auxiliary tools, libraries, and language bindings. Documentation is online.
• ICCARUS 3D social network visualization
• http://www.viddler.com/explore/rich115/videos/1/79.766/
a 3D data visualization of the real-time social networks behind scouta.com. ICCARUS, short for "Interactive Command Console & Relational User Statistics", consists of different traditional network graphs that convey the social network between members, the memberships of groups, & the links between members & the content they explore.
a 3D data visualization of the real-time social networks behind scouta.com. ICCARUS, short for "Interactive Command Console & Relational User Statistics", consists of different traditional network graphs that convey the social network between members, the memberships of groups, & the links between members & the content they explore.
• IKNOW **
• http://www.spcomm.uiuc.edu/teclab/iknow/
Category : Program for analysing Networks
Source : Noshir Contractor / TECLab UC Illinois
Status :IKNOW is software copyrighted by the University of Illinois at Urbana-Champaign. Downloads fonline can only be used for non-commercial purposes. For more information : http://www.spcomm.uiuc.edu/teclab/iknow/downloads.html
Difficulty :Need SNA knowledge
Summary :IKNOW (Inquiring Knowledge Networks on the Web) is a Web based E-solution that was created to assist organizations, communities, or individual team to manage their knowledge assets. IKNOW helps an organization by putting in place a mapping, visualization, and measurement system that can help organizations to study the patterns of knowledge and information flow though an organizations informal network. This, in turn, can help enhance an organization’s capability to identify critical patterns of knowledge distribution and information flow, and thus, more effectively manage these knowledge assets. IKNOW provides the focus associated with mapping, measurement and visualization of knowledge networks and combines it with the power of structured collaboration. Further its ability to run on many popular Web platforms enhances its ease of use.
• KrackPlot
• http://www.andrew.cmu.edu/user/krack/krackplot.shtml
Category : Program for analysing Networks
Source : David Krackhardt Carnegie Mellon University
Status : You can download your own copy of the KrackPlot software for your own personal use on the web site
Difficulty :Need SNA knowledge
Summary :KrackPlot is a program for network visualization designed for social network analysts. KrackPlot uses a simple screen-oriented interface. You can drag nodes with the mouse to move them and click to add new nodes. Each node can be assigned a number of attributes, which can be highlighted using color and shape. KrackPlot will assign colors and shapes automatically based on the attributes, or you can control them.
• Keyplayer 1.44
• http://www.analytictech.com/keyplayer/keyplayer.htm
Category : Program for analysing Networks
source : analytictech
status : free
difficulty : need some SNA knowledge
compatibility :The program is distributed with two other free programs, namely Pajek (written by Vladimir Batagelj and Andrej Mrvar) and Mage (written by Richardson and Richardson). Pajek has nice 2-D graphics and a host of analytical tools, while Mage provides 3-D graphics.
Summary : KeyPlayer is free and may be freely distributed. For more information about the program, contact its author, Steve Borgatti, at steve@analytictech.com or +1 978 456 7372. In addition, latest versions of the program may be found at www.analytictech.com .
KeyPlayer is a program for identifying an optimal set of nodes in a network for one of two basic purposes: (a) crippling the network by removing key nodes, and (b) selecting which nodes to either keep under surveillance or to try to influence via some kind of intervention. The two purposes are different and require different procedures. KeyPlayer 1.4 provides two approaches for the first goal, and one approach for the second.
• Moviemol

• http://www.fos.su.se/moviemol.html
Category : Program for analysing Networks / chemistry computer program designed to display dynamic molecular structure. Moviemol can be adapted to display of the dynamics of changing network structures
Source :The Moviemol Molecular Animation Program, moviemol@kemi.uu.se
Status :The program can be obtained from the authors or by anonymous ftp from ftp.fos.su.se . (It can also be obtained by anonymous ftp from chem-ftp.mps.ohio-state.edu .) The program is free-of-charge for academic researchers and the price is modest for commercial establishments. The most recent version is version 1.3.1.
Difficulty :Need SNA knowledge
Summary :Moviemol is a program for visualization and animation of molecular structures for SGI and IBM RISC/6000 workstations and for PCs running DOS or Linux. Moviemol typically takes sets of molecular coordinates and displays each of these sets or frames one after the other to create a "movie". The molecules/atoms/ions are displayed in ball-and-stick form. At any moment during the animation, the molecules can be rotated or translated, magnified or diminished. The input is simple and the program is easy to run . The program also produces very nice postscript images of publication quality.
• MultiNet
• http://www.sfu.ca/%7Erichards/Multinet/Pages/multinet.htm
Category : Program for analysing Networks
Source : Bill Richards and Andrew Seary.
Status :To obtain the latest version of MultiNet, please write to richards@sfu.ca and tell us a bit about yourself and what you hope to do with MultiNet. Please say more than "I want to test MultiNet" or "I am getting into SNA."
Difficulty : Need SNA knowledge
Summary :Multinet is an interactive graphical program designed for exploratory analysis of large, complex, multivariate networks (for egocentric or ordinary data). Includes, among other things, four kinds of spectral analysis and p*. Graphic display of all results. MultiNet is a data analysis package that can be used for ordinary data (in which you have a file that has one line of data for each case) and for network data (in which there are two files -- the "node" file describes the individuals and the "link" file describes the connections between individuals). For a complete information about the program and its specificity : http://www.sfu.ca/%7Erichards/Multinet/Pages/howmn.htm
• Negopy
• http://www.sfu.ca/%7Erichards/Pages/negopy4.html
Category : Program for analysing Networks
Source : Bill Richards
Status :To obtain a package, send an e-mail request to
 To obtain the latest version of Negopy, please write to richards@sfu.ca
and tell us a bit
about yourself, your research, what university and department you are in, and what
you hope to do with Negopy. Please say more than "I want to test Negopy" or "I am
getting into SNA."
To obtain the latest version of Negopy, please write to richards@sfu.ca
and tell us a bit
about yourself, your research, what university and department you are in, and what
you hope to do with Negopy. Please say more than "I want to test Negopy" or "I am
getting into SNA."
Pricing : Negopy is now shareware. If you find the program useful, please send a check for a suitable amount written to "SFU-Negopy". Funds received will be used for program development and student assistants. Please send the check to Bill Richards at Simon Fraser University, School of Communication, 8888 University Drive, Burnaby, BC, Canada V5A 1S6. If you do this, a hardcopy printed version of the manual -- easier to use than the pdf version at http://www.sfu.ca/~richards/Pdf-ZipFiles/negman98.pdf -- will be sent to you in thanks. Difficulty :Need SNA knowledge
Summary :One of the oldest network analysis programs, NEGOPY finds cliques, liaisons, and isolates in networks having up to 1,000 members and 20,000 links. In use at over 100 universities and research centers around the world.
NEGOPY is a discrete, linkage-based program for the analysis of networks. The primary goal of the program is to define clusters of nodes that have more contact with one another than with nodes in other clusters. These clusters are called groups, and are conceptually similar (but not identical) to the "cliques" often referred to in the sociometric literature. NEGOPY also sorts nodes into a number of role categories on the basis of their linkage with one another. Final descriptions of the network and its members are expressed in terms of links between the nodes, rather than in terms of abstract patterns of variance, etc.
Category : Program for analysing Networks
Source : Bill Richards
Status :To obtain a package, send an e-mail request to
To obtain the latest version of Negopy, please write to richards@sfu.ca
and tell us a bit
about yourself, your research, what university and department you are in, and what
you hope to do with Negopy. Please say more than "I want to test Negopy" or "I am
getting into SNA." Pricing : Negopy is now shareware. If you find the program useful, please send a check for a suitable amount written to "SFU-Negopy". Funds received will be used for program development and student assistants. Please send the check to Bill Richards at Simon Fraser University, School of Communication, 8888 University Drive, Burnaby, BC, Canada V5A 1S6. If you do this, a hardcopy printed version of the manual -- easier to use than the pdf version at http://www.sfu.ca/~richards/Pdf-ZipFiles/negman98.pdf -- will be sent to you in thanks. Difficulty :Need SNA knowledge
Summary :One of the oldest network analysis programs, NEGOPY finds cliques, liaisons, and isolates in networks having up to 1,000 members and 20,000 links. In use at over 100 universities and research centers around the world.
NEGOPY is a discrete, linkage-based program for the analysis of networks. The primary goal of the program is to define clusters of nodes that have more contact with one another than with nodes in other clusters. These clusters are called groups, and are conceptually similar (but not identical) to the "cliques" often referred to in the sociometric literature. NEGOPY also sorts nodes into a number of role categories on the basis of their linkage with one another. Final descriptions of the network and its members are expressed in terms of links between the nodes, rather than in terms of abstract patterns of variance, etc.
• NetDraw
• http://www.analytictech.com/Netdraw/netdraw.htm
Category : Program for analysing Networks
Source : Steve Borgatti
Status :NetDraw is a free program
Difficulty :Nedd SNA Knowledge
compatibility : The program reads UCINET system files, UCINET DL files, Pajek files, and its own VNA format (which allows saving network and attribute data together, along with layout information like spatial coordinates, colors, etc.). IMPORTANT: If you format data as a VNA file, NETDRAW can handle *very* large files. For example, sparse networks of 3500 nodes are very practical on a machine with 1GB of RAM (more is better). 10,000 nodes works fine with 2GB of RAM (assuming it is very sparse, of course).
Sumary :NetDraw is a free program written by Steve Borgatti for visualizing both 1-mode and 2-mode social network data. It can handle multiple relations at the same time, and can use node attributes to set colors, shapes, and sizes of nodes. Pictures can be saved in metafile, jpg, gif and bitmap formats.
• NetMiner
• http://www.netminer.com/NetMiner/home_01.jsp
Category : Program for analysing Networks
Source :Cyram Co., Ltd
Status : commercial
Difficulty :Need SNA knowledge
Summary : Netminer is an innovative software tool for exploratory network data analysis and visualization. "Its unique feature lies in the integration of standard and the latest social network analysis(SNA) methodology with modern graph drawing techniques in the spirit of exploratory data analysis(EDA). Cyram NetMiner can be used for general research and teaching in social networks. Also, it can be effectively applied to various business fields, where network-structural factors have great deal of influences on the performance: e.g. intra- and inter-organizational, financial, Web, criminal/intelligence, informetric, telecommunication, distribution, transportation networks.
• NetVis
• http://www.netvis.org/
Category : Program for analysing Networks
Source :Jonathon N. Cummings /Carnegie Mellon University
Status :NetVis Module is a free open source web-based tool
Difficulty :Need SNA knowledge
Summary :NetVis Module is a free open source web-based tool designed to simulate, analyze, and visualize social networks using data from csv files, online surveys, and geographically dispersed work teams.
• Network Genie / program for collecting network data
• https://secure.networkgenie.com/
Network Genie makes it easy and affordable to design and manage social network survey projects.
Network Genie helps you:
• Design network surveys and survey questions.
• Manage social network projects.
• Collect social network data using online forms.
• Download and export data to the social network analysis program of your choice.
Registration is easy and free.
• OGDF
•
CATEGORIE1 : MAPPING
CATEGORIE2 : Tools to visualize Networks
CATEGORIE3 : Program for analysing Networks
TITLE : OGDF
SUBTITLE : Open Graph Drawing Framework
SOURCE : University Dortmund, University of Cologne, oreas GmbH, Cologne
TYPE : Program
URL : http://www.ads.tuwien.ac.at/AGD/
STATUS : Publically available for academic use -free
DIFFICULTY : Need some expertise
COMPATIBILITY :
RATE : *
DESCRIPTION : OGDF is a self-contained C++ class library for the automatic layout of diagrams. OGDF offers sophisticated algorithms and data structures to use within your own applications or scientific projects. The library is available under the GNU General Public License.
IMAGE :
LABELS : Networks visualization program - free - C++
• Orgnet. com
• http://www.orgnet.com/
Category : Program for analysing Networks
Source : Valdis krebs / InFlow software
Status : commercial
Difficulty need serious knowledge in SNA
Summary :Social Network Analysis Software and Services
Category : Program for analysing Networks
Source : Valdis krebs / InFlow software
Status : commercial
Difficulty need serious knowledge in SNA
Summary :Social Network Analysis Software and Services
• Pajek***
• http://vlado.fmf.uni-lj.si/pub/networks/pajek/default.htm
Category : Program for analysing Networks
Source : Valdis krebs
Status : free for noncommercial use
Difficulty ; need serious knowledge in SNA
compatibility : Pajek runs on Windows
Summary : This program runs under Windows NT/9x and provides some analysis tools for large networks and graph-drawing capabilities
• Repast
• http://repast.sourceforge.net/
Repast Simphony (Repast S) extends the Repast portfolio by offering a new approach to simulation development and execution, including a set of advanced computing technologies for applications such as social simulation. North et al. (2005), provides an overview of Repast S and Tatara et al. (2006) provides a short tutorial. The Developer's Alpha 1 Release is intended to be used by software developer's who are comfortable with Java development and are willing to work with a brand new system. It is not intended for analysts or others unfamiliar with Java. A later release of Repast Simphony will offer analysts the ability to create basic models without needing to know Java. This is the first alpha level release.
Repast Simphony (Repast S) extends the Repast portfolio by offering a new approach to simulation development and execution, including a set of advanced computing technologies for applications such as social simulation. North et al. (2005), provides an overview of Repast S and Tatara et al. (2006) provides a short tutorial. The Developer's Alpha 1 Release is intended to be used by software developer's who are comfortable with Java development and are willing to work with a brand new system. It is not intended for analysts or others unfamiliar with Java. A later release of Repast Simphony will offer analysts the ability to create basic models without needing to know Java. This is the first alpha level release.
• SEMASPACE **
• http://residence.aec.at/didi/FLweb/
Category : Program for analysing Networks
Compatibility : need the virtools plugin
SemaSpace is a fast and easy to use graph editor for large knowledge networks, specially designed for the application in non technical sciences and the arts. It creates interactive graph layouts in 2d and 3d by means of a flexible algorithm. The system is powerful enough for the calculation of complex networks and can incorporate additional data such as images, sounds and full texts.
• SIENA
• http://stat.gamma.rug.nl/snijders/siena.html
Category : Program for analysing Networks
Source : Tom Snijders
Status : downloadable form Stocnet
Difficulty : Need serious knowledge in SNA (the site provides link toward various documentation)
compatibility : The programs are written in Delphi, for use under Windows.
Summary : SIENA is a program for the analysis of repeated (longitudinal, dynamic) data on complete social networks; and for Maximum Likelihood estimation in the Exponential Random Graph Model (ERGM), also called p* model. This program can also be used to analyse the simultaneous and mutually dependent dynamics of the social network and the behavior, attitudes, etc., of the actors constituting the network. The name SIENA stands for Simulation Investigation for Empirical Network Analysis. The basic approach used by SIENA for modeling network dynamics is an actor-oriented model, in which it is assumed that the social actors who are represented by the nodes in the network play a crucial role in changing their ties to other actors; in the case of associated behavior dynamics, also in changing their behavior.
• Skyrails (beta)
• http://cgi.cse.unsw.edu.au/~wyos/skyrails/index.php
Author(s):
Yose Widjaja
Institution:
Computer Science and Engineering at the University of New South Wales
Year:
2007
URL:
http://cgi.cse.unsw.edu.au/~wyos/skyrails/index.php
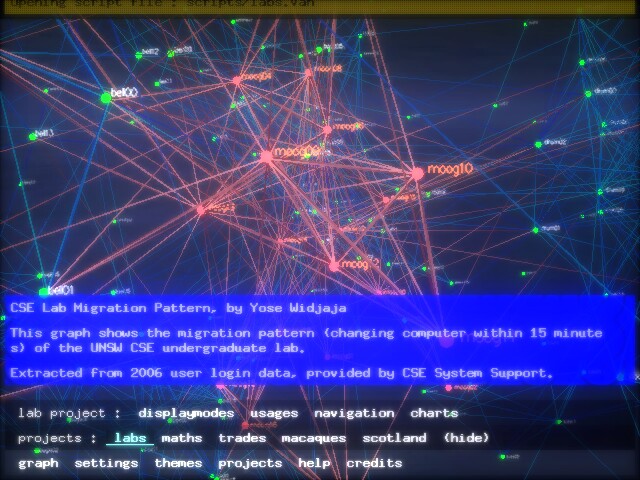
Skyrails is a social network (or any graph really) visualization system. It has a built in programming language for processing (as far as visualisation attributes goes) the graph and its attributes. The system is not only aimed at expert users though, because through the scripting languages menus can be built and the system can be used by any users.
The main distinguishing point of the system comes from the built in scripting language, the added flexibility of how to represent attributes (nodes can be binded to planes and spheres based on their attributes) and the scriptability of the user interface system. This makes skyrails ideal for creating presentations targeted at the average users.
difficulty : The system is not solely aimed at expert users.
Author(s):
Yose Widjaja
Institution:
Computer Science and Engineering at the University of New South Wales
Year:
2007
URL:
http://cgi.cse.unsw.edu.au/~wyos/skyrails/index.php
Skyrails is a social network (or any graph really) visualization system. It has a built in programming language for processing (as far as visualisation attributes goes) the graph and its attributes. The system is not only aimed at expert users though, because through the scripting languages menus can be built and the system can be used by any users.
The main distinguishing point of the system comes from the built in scripting language, the added flexibility of how to represent attributes (nodes can be binded to planes and spheres based on their attributes) and the scriptability of the user interface system. This makes skyrails ideal for creating presentations targeted at the average users.
difficulty : The system is not solely aimed at expert users.
• Social network visualization
• http://der-mo.net/relationBrowser/RB_v1.15_demo/social%20network/index.html
(based on the relation browser : CIA world factbook demo)
see also http://getoutfoxed.com/visualization
an open source will be released soon
(based on the relation browser : CIA world factbook demo)
see also http://getoutfoxed.com/visualization
an open source will be released soon
• SocNetV / Social Network Visualizer for Linux
• http://socnetv.sourceforge.net/
Category : Program for analysing Networks
source : Dimitris B. Kalamaras
status : free
Difficulty : Need SNA knowldge
compatibility : application for the Linux desktop written in C++/Qt.
Summary : SocNetV is an application for the Linux desktop written in C++/Qt. Its main objective is to provide a sensible means for Social Networks Analysis and Visualisation on the Linux platform, while practicing the K.I.S.S. directive (KISS: Keep it simple, stupid). The program is completely stand-alone with no strange library dependencies (only Qt is required). With it, you can read and visualise various network file formats and/or visually create and modify a network using your mouse. SocNetV will happily compute network and actor properties, such as distances, centralities, diameter etc, for you. Furthermore, it can create simple random networks (lattice, same degree, etc). Be aware, there is no warranty of efficiency, correctness or usability.
• SONIA : Social network Image Animator ***
• http://www.stanford.edu/group/sonia/
In progress but to be followed closely. SONIA is a package for visualizing dynamic or longitudinal "network" data. In addition to information about the relations (ties) between various entities (actors, nodes) there is also information about when these relations occur, or at least the relative order in which they occur.
In progress but to be followed closely. SONIA is a package for visualizing dynamic or longitudinal "network" data. In addition to information about the relations (ties) between various entities (actors, nodes) there is also information about when these relations occur, or at least the relative order in which they occur.
• StocNet
• http://stat.gamma.rug.nl/stocnet/
Category : Program for analysing Networks
source : Tom Snijders
status : Free
difficulty : Need SNA knowldge
compatibility : runs under windows
summary : StOCNET is an open software system for the statistical analysis of social networks using advanced statistical models. StOCNET provides a platform to make a number of statistical methods, that previously were privately owned, available to a wider audience. The distinguishing feature of the methods included in the StOCNET system is that they are based on explicit probability models for networks.
• Swarm creativity
• http://www.swarmcreativity.net/,
click on "Coolhunting".
TeCFlow software can be downloaded from http://www.ickn.org.
Usefulness to be tested.
TeCFlow software can be downloaded from http://www.ickn.org.
Usefulness to be tested.
• Tom Saywer Software
• http://www.tomsawyer.com/home/index.php
Category : Program for analysing Networks /information visualization
source : Tom Saywer
status : commercial
difficulty : Need SNA Knowledge
compatibility
summary : Tom Sawyer Software is the premier provider of high performance graph visualization, layout, and analysis systems that enable you to see and interpret complex information to make better decisions.
• TULIP
• http://www.tulip-software.org/
Category : Program for analysing Networks / infoviz
source : David Auber http://www.labri.fr/perso/auber/
status : software under GPL licence and can be freely downloaded at SourceForge : http://sourceforge.net/project/showfiles.php?group_id=61223
difficulty : need SNA knowledge
compatibility
summary : Tulip is a contribution of the area of information visualization, “InfoViz”. Even if the Tulip framework allows the visualization, the drawing and the edition of small graphs, all the parts of the framework have been built in order to be able to visualize graphs having more than 1.000.000 elements. Such a visualization system must draw and display huge graphs, allows the navigation through geometric operations as well as the extraction of subgraphs and the enhancement of the results obtained by filtering.
• UCINET ****
• http://www.analytictech.com/ucinet/ucinet.htm
Category : Program for analysing Networks
source : Steve Borgatti
status : The full program can be downloaded and used free for 30 days. For longer use, individual students pay $40, schools & government pay $150, and corporations pay $250. In addition, generous volume discounts / site licenses are available.
difficulty : need SNA knowledge
compatibility : with MAGE and PAJEK
summary : A comprehensive package for the analysis of social network data as well as other 1-mode and 2-mode data. Can read and write a multitude of differently formatted text files, as well as Excel files. Can handle a maximum of 32,767 nodes (with some exceptions) although practically speaking many procedures get too slow around 5,000 - 10,000 nodes. Social network analysis methods include centrality measures, subgroup identification, role analysis, elementary graph theory, and permutation-based statistical analysis. In addition, the package has strong matrix analysis routines, such as matrix algebra and multivariate statistics.
Integrated with UCINET is the NetDraw program for drawing diagrams of social networks. In addition, the program can export data to Mage and Pajek.
• Visone *
• http://visone.info/
Category : Program for analysing Networks
source : Algorithms & Data Structures Group in the Department of Computer & Information Science, and the Domestic Politics & Public Administration Group in the Department of Politics & Management, both at the University of Konstanz and a network of collaborations, with members in several different universities.
status : visone is free for academic and research purposes, and no registration is required. simply use Java Web Start or download any of the following (i.e., right-click on a link and select "Save Link As...").
difficulty : easy to use
compatibility : Using Java Web Start is the recommended way to start visone.
summary : visual analysis of social networks. visone is a long-term research project, in which models and algorithms to integrate and advance the analysis and visualization of social networks are being developed. An important part of visone is the design and implementation of a software tool intended for research and teaching in social network analysis. It is specifically designed to allow experts and novices alike to apply innovative and advanced visual methods with ease and accuracy.
• Yfiles
• http://www.yworks.com/en/products_yfiles_about.htm
Category : Program for analysing Networks / information visualization
source : yWorks
status : commercial
difficulty : seems to be easy
compatibility :
summary : yFiles is an extensive Java™ class library that provides algorithms and components enabling the analysis, visualization, and the automatic layout of graphs, diagrams, and networks.
• Zo
• http://stat.gamma.rug.nl/snijders/#progZO
Category : Program for analysing Networks
source : Tom Snijders
summary : Tom A.B. Snijder's collection of programs to analyze 0/1 matrices.
Category : Program for analysing Networks
source : Tom Snijders
summary : Tom A.B. Snijder's collection of programs to analyze 0/1 matrices.
• Going further in Network Analysis Visualization
• Center for complex networks research
• http://www.nd.edu/%7Enetworks/
Barabazi's website (univ. Notre Dame), publications, ressources, gallery, netlibrary...
Barabazi's website (univ. Notre Dame), publications, ressources, gallery, netlibrary...
• Economic and social network
• http://www.econ.iastate.edu/tesfatsi/netgroup.htm
Very complete website on Economic/ social networks, links to more specific websites.
Very complete website on Economic/ social networks, links to more specific websites.
• Virtual Observatory for the study of online Networks **
• http://voson.anu.edu.au/index.html
The Virtual Observatory for the Study of Online Networks projet is conducting empirical social science research into networks on the WWW and developing e-Research (cyberinfrastructure) tools to faciliate this research. To date, the VOSON software has been used to study the web networks formed by political parties and environmental activist groups and also "issue networks" relating to migration and abortion.
The Virtual Observatory for the Study of Online Networks projet is conducting empirical social science research into networks on the WWW and developing e-Research (cyberinfrastructure) tools to faciliate this research. To date, the VOSON software has been used to study the web networks formed by political parties and environmental activist groups and also "issue networks" relating to migration and abortion.
• DIAGRAM : Network tools and file formats **
• http://mdround.blogs.com/usingnetworks/2007/04/diagram_network.html
A route-map to navigate a path through the various apps and translation utilities to get your data into the particular application that can do the analysis you need.
A route-map to navigate a path through the various apps and translation utilities to get your data into the particular application that can do the analysis you need.
• Network visualization tools
• http://www.caida.org/funding/internetatlas/viz/viztools.html
Directory of networks visualization tools, with cost and description, direct access to software when they are free/opensource.
Directory of networks visualization tools, with cost and description, direct access to software when they are free/opensource.