Tools for scientometric analysis
• Scientometric tools
• Authormap : Citation mapping and visualization *
• http://project.cis.drexel.edu/authorlink/
Keywords : scientometric tool - citation mapping - visualization - author - search tool
AuthorMap explores author relationships through co-citation patterns. The assumption is that if two authors are often cited together by many other authors, these two authors likely have common intellectual interest in their research and writing. When many related authors' pair-wise co-citation patterns are explored, we will have a map of a subject domain where authors on the map represent ideas or subtopics as well as their relationships. AuthorMap currently attaches to ISI Arts & Humanities Citation Index (AHCI), 1988-1997, about 1.26 million records.
When an author search is conducted, AuthorMap generates a list of 25 authors co-cited most often with the given author. The user then can choose to interact with two types of maps that visualize how these author related to each other based on their co-citation counts. One map is based on Kohone's self-organizing feature map (SOM), the other is based on Path Finder Network(PFNET). Both maps are generated within seconds. Both maps allow the user to drag the names on the maps and drop them to a search box to activate an automatic search by the underlying search engine. plato-2-2.gif
Keywords : scientometric tool - citation mapping - visualization - author - search tool
AuthorMap explores author relationships through co-citation patterns. The assumption is that if two authors are often cited together by many other authors, these two authors likely have common intellectual interest in their research and writing. When many related authors' pair-wise co-citation patterns are explored, we will have a map of a subject domain where authors on the map represent ideas or subtopics as well as their relationships. AuthorMap currently attaches to ISI Arts & Humanities Citation Index (AHCI), 1988-1997, about 1.26 million records.
When an author search is conducted, AuthorMap generates a list of 25 authors co-cited most often with the given author. The user then can choose to interact with two types of maps that visualize how these author related to each other based on their co-citation counts. One map is based on Kohone's self-organizing feature map (SOM), the other is based on Path Finder Network(PFNET). Both maps are generated within seconds. Both maps allow the user to drag the names on the maps and drop them to a search box to activate an automatic search by the underlying search engine.
plato-2-2.gif

• Bibcouple.exe - for visualization of the bibliographic coupling among authors using a WoS set
• http://users.fmg.uva.nl/lleydesdorff/software/bibcoupl/index.htm
BibCoupl.exe is freely available for academic usage. The program uses a set saved using ISI’s Web of Science as input, and generates various forms of output.
BibCoupl.exe is freely available for academic usage. The program uses a set saved using ISI’s Web of Science as input, and generates various forms of output.
• BibJourn.exe - for visualization of the bibliographic coupling in terms of cited journals
• http://users.fmg.uva.nl/lleydesdorff/software/bibjourn/index.htm
This program enables one to generate a representation of the knowledge base of a document set. This can also be used as an indicator of the knowledge base of an institutional set, for example, by downloading the recent papers of the authors involved. (BibJourn.exe is freely available for academic usage.)
This program enables one to generate a representation of the knowledge base of a document set. This can also be used as an indicator of the knowledge base of an institutional set, for example, by downloading the recent papers of the authors involved. (BibJourn.exe is freely available for academic usage.)
• Citespace : visualizing patterns and trends in scientific literature
• http://cluster.cis.drexel.edu/%7Ecchen/citespace/
CiteSpace is a Java application, freely available to use. It requires Java Runtime Environment (JRE) 1.4.2 or higher to run. Internet connections are not essential, although CiteSpace retrieves additional information from PubMed and a number of web services if an Internet connection is available.
CiteSpace is a Java application, freely available to use. It requires Java Runtime Environment (JRE) 1.4.2 or higher to run. Internet connections are not essential, although CiteSpace retrieves additional information from PubMed and a number of web services if an Internet connection is available.
• Co-auth.exe - program for visualization of the coauthorship network using a WoS set
• http://users.fmg.uva.nl/lleydesdorff/software/coauth/index.htm
This program enables one to generate a representation of the coauthorship relations in a document set. Input is a set saved using ISI’s Web of Science
This program enables one to generate a representation of the coauthorship relations in a document set. Input is a set saved using ISI’s Web of Science
• Fulltext.exe - software for co-word mapping of full texts
• http://users.fmg.uva.nl/lleydesdorff/software/fulltext/index.htm
Keywords : software -co-word mapping of full texts -word-occurrence matrix
FullText.exe is freely available for academic usage. The program generates a word-occurrence matrix, a co-occurrence matrix, and a normalized co-occurrence matrix from a set of text files and a word list. The output files can be read into standard software (like SPSS, Ucinet/Pajek, etc.) for the statistical analysis and the visualization.
• HistCite**
• http://www.histcite.com/index.htm
HistCite has a wide array of features to help you analyze and visualize your bibliography.
Analytical Features
• Complete author list with papers published and citation ranks.
• Complete journal list with papers published and citation ranks.
• Complete list of countries of origin of papers published and citation ranks
• Complete list of institutions of origin of papers published and citation ranks
• Complete list of departments within institutions of origin of papers published and citation ranks.
• Compiled list of title words
• Compiled list of all cited references. This can be used to identify article important to the topic of your collection that were not picked up by your search.
• Analysis by year of publication
• Analysis by language of publication
• Analysis by document type (research article, review, letter, etc.)
Search, Filter, Tag and Export
• HistCite contains a search engine that allows you to search for records that meet your criteria.
• HistCite allows you to click on any title word, author or journal name to see a filtered list of records that contain that search term.
• You can save your subsets of records by adding custom-named tags to the records.
• Subsets of records can be exported from collections for further analysis.
Graphical
• The HistCite Graph Maker allows you to create historiographs — graphical representations of the historical development of a research field — of selected articles within your collection.
Editing
HistCite has several built in features to make editing your data collection easy.
• Edit multiple records simultaneously to unify spelling variations in authors, addresses, or cited records.
• Add records manually into your collection. This is useful if you want to add books or other document types that are not indexed in the Web of Science.
• Automatically search and download records from the Web of Science to add to the collection.
Output
HistCite outputs subsets of data in many different formats for analysis in other programs, for incorporation into publications and presentations, and for presentation on web sites.
• Excel-compatible comma-separated value files from all analytical tables.
• High-quality graphics from Graph Maker.
• Subsets of network data compatible with widely used network analysis programs such as Pajek or NetDraw.
• Complete or selected HTML presentations of your analysis suitable for presentation on a web site.
•
• IntColl.exe - for visualization of international collaboration
• http://users.fmg.uva.nl/lleydesdorff/software/intcoll/index.htm
This program enables one to generate a representation of the international coauthorship relations in a document set in terms of the participating countries. Input is a set saved using ISI’s Web of Science.
This program enables one to generate a representation of the international coauthorship relations in a document set in terms of the participating countries. Input is a set saved using ISI’s Web of Science.
• ISI.exe - for organizing a set downloaded from the Web-of-Science into databases for relational database management.
• http://users.fmg.uva.nl/lleydesdorff/software/isi/index.htm
ISI.exe is freely available for academic usage. It is for organizing a set downloaded from the Web-of-Science into databases for relational database management.
ISI.exe is freely available for academic usage. It is for organizing a set downloaded from the Web-of-Science into databases for relational database management.
• RefViz
• http://www.refviz.com/
for exploring reference collections based on content. RefViz provides an at-a-glance overview and reveals trends and associations in references—now you can retain important references otherwise lost when narrowing a search or skimming a list. RefViz processes each dataset with an unbiased review of all terms found in the title and abstract/notes fields. It essentially groups the literature the same way you would stack papers. Two visualizations are provided to review the literature: the galaxy and the matrix.
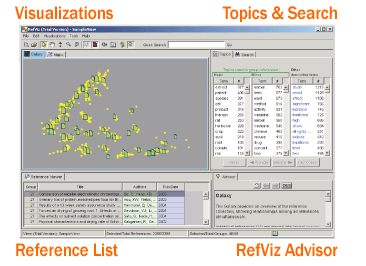 Picture 3.png
for exploring reference collections based on content. RefViz provides an at-a-glance overview and reveals trends and associations in references—now you can retain important references otherwise lost when narrowing a search or skimming a list. RefViz processes each dataset with an unbiased review of all terms found in the title and abstract/notes fields. It essentially groups the literature the same way you would stack papers. Two visualizations are provided to review the literature: the galaxy and the matrix.
Picture 3.png
• TI.exe - co-word mapping of texts
• http://users.fmg.uva.nl/lleydesdorff/software/ti/index.htm
Keyword : software - co-word mapping - texts - free
TI.exe is freely available for academic usage. The program generates a word-occurrence matrix, a word co-occurrence matrix, and a normalized co-occurrence matrix from a set of lines (e.g., titles) and a word list. The output files can be read into standard software (like SPSS, Ucinet/Pajek, etc.) for the statistical analysis and the visualization.