Creating animations that play an animated ABAQUS contour plot synchronized
with a 2D x-y plot
The following software is required to create an animation: ABAQUS Viewer
6.4, Matlab 6.5, Corel Rave 3. Also, you will need plenty of free hard drive
space for working with the animations!!
Part 1: ABAQUS
Part 2: Matlab
Part 3: Corel Rave
PART 1: ABAQUS
- Making sure you have the same number of contour frames as x-y data points
is critical!
To achieve one contour frame for each x-y data point in the step, make
sure the step time divided by the field number interval
is equal to the history time interval :

NOTE: If you would like more x-y data points per contour frame, first calculate
the history time interval as above, then divide it by the number
of points you would like per contour frame. You will have to compensate
for this later in Matlab by changing the frame data point interval.
- Run your ABAQUS job then open the ODB file in ABAQUS viewer.
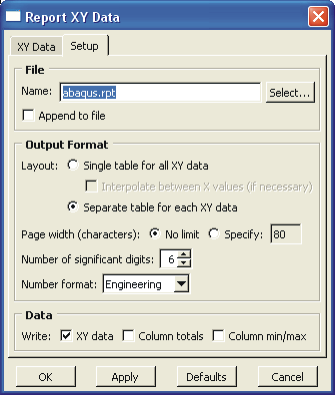
- Create your combined x-y data set and export it as a text file. Make
sure you uncheck the "Append to file" check box, and select the "Separate
table for each XY data" radio box.
- Select the field variable contour plot that you would like to animate
by choosing "Result" --> "Field Output..." and then selecting the
appropriate variable in the Filed Output dialog box.

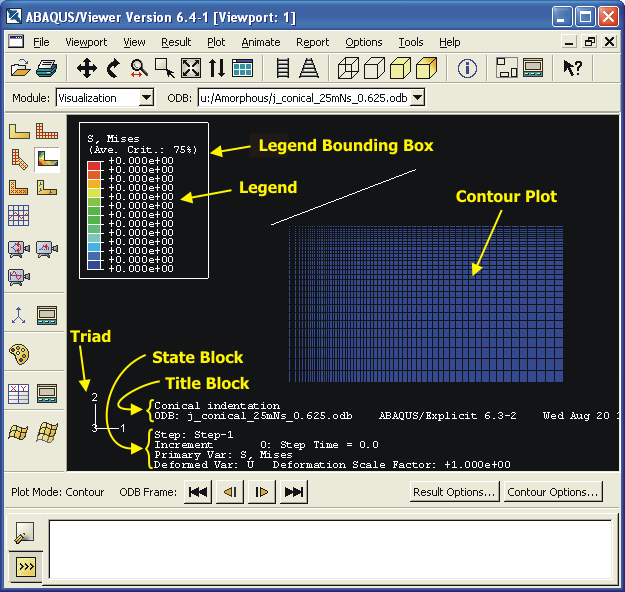
- Clean up the viewport by removing the title block and other items.
Select "Viewport" --> "Viewport Annotation Options...". On each of
the tabs of the dialog box, you have the option to hide the triad,
the legend, the legend bounding box, the title
block, and the state block.
- Put the contour plot in "Animate: Time History" mode by selecting
this button:

- The animation will begin to play. Press the stop button in the animation
controls.
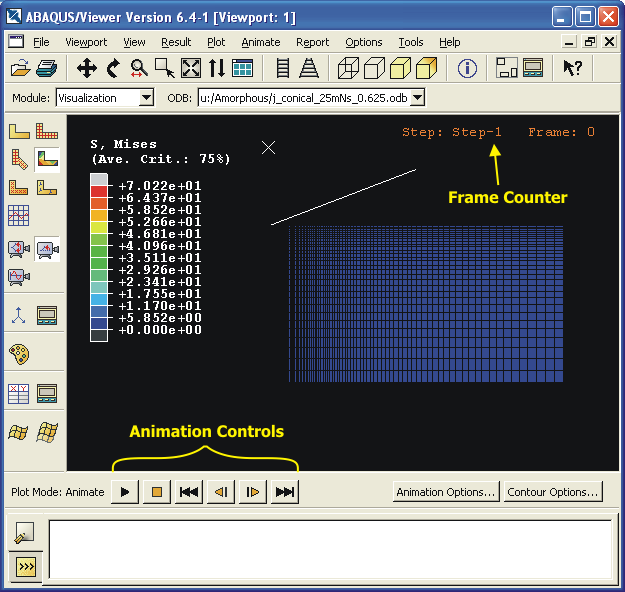
- To remove the frame counter, press "Animation Options..."
in the lower right corner of the Viewer window. In the dialog, clear
the "Show Frame Counter" option.
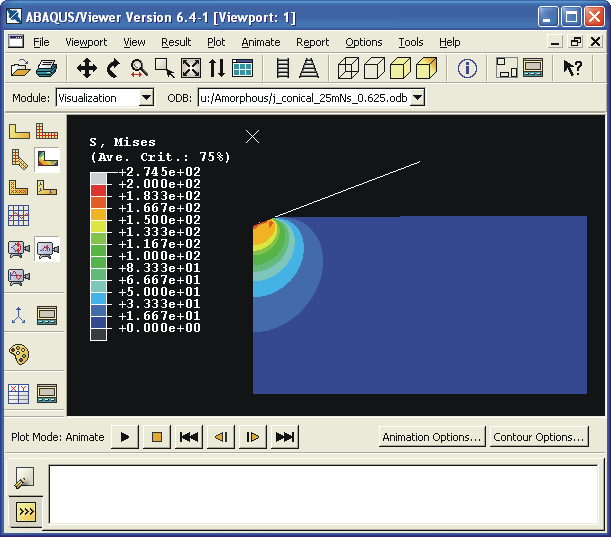
- To hide the contour mesh, press "Contour Options..." in the lower
right corner of the Viewer window. On the "Basic" tab select "Feature
edges" in the Visible edges section.
- To fix the legend so that its max and min values don't change
during the animation, on the "Limits" tab of the "Contour Options..."
dialog box, set the Max and Min values for the legend... do not select
"Auto Compute".

- ABAQUS records every pixel that is visible in the viewport when it creates
an animation file. Arrange the contour plot in the viewport so
that it is visible throughout the entire animation. Resize the viewport
to minimize the black space around the contour plot.
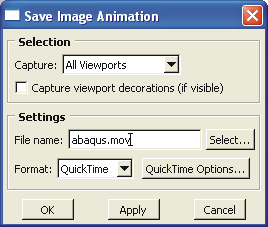
- Save the animation to file. Select "Animate" --> "Save As..."
from the menu. Clear the "Capture viewport decorations" field. Enter
the file name. Choose the "QuickTime" format. In "QuickTime Options..."
be sure that "Use size on screen" is checked.
PART 2: Matlab
- Obtain a copy of the animate_plot.m
and importAbaqus.m
Matlab functions, and move them to a place where Matlab can find them
- Open the animate_plot.m file and edit it to suit your needs. The
sections that you should not edit are clearly marked. Some things that
you may want to change include:
- data scaling factor (e.g. scaling from N to kN)
- axis limits
- frame data point interval (number of x-y data points per frame,
default = 1)
- axis labels and plot title
- line widths and colors
- output file name
- Open Matlab and run the script by typing "animate_plot(path_to_rpt_file)"
at the prompt. Do not cover the figure with other windows or you may
record those instead.
- When the script is finished, it will output some information about
the movie file that was created. Write down the Height and Width, you
will need these numbers later in Corel RAVE. Example output:
ans =
Filename: 'mymovie.avi'
FileSize: 70564864
FileModDate: '02-Apr-2004 17:46:43'
NumFrames: 100
FramesPerSecond: 15
Width: 560
Height: 420
ImageType: 'truecolor'
VideoCompression: 'none'
Quality: 0
NumColormapEntries: 0
PART 3: Corel RAVE
- Now you should have two animation files ready to be merged into one
animation. Open Corel RAVE to complete this final step.
- Import both of your animations into RAVE by selecting "File" -->
"Import..." from the menu. In the timeline at the bottom of the window
the two animations are each indicated by "Group of X Objects", where
X is the number of frames in each animation. Make sure these are equal!!

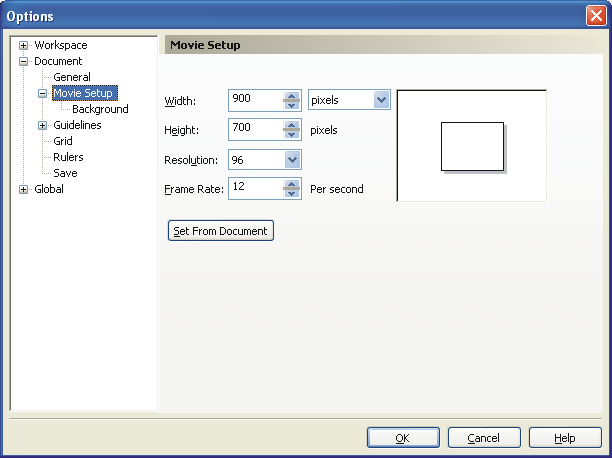
- Change the final animations settings by selecting "Movie" -->
"Movie Setup" from the menu.
- Set the movie height and width in pixels. For a PowerPoint presentation,
the dimensions should be no larger than 1024 wide x 768 high
(which is full screen on our projector). 900 x 700 is a good size
that will leave a nice border around the movie in PowerPoint.
- Set the resolution to 96 dpi.
- Set the frame rate to your desired speed. If your output movie
is too fast, then you can slow it down by reducing the frame rate.
- Select "Background" in the left frame of the dialog. Set the
background color to Black.
- Arrange the animations to fit inside final animation frame. Resize
the original animations if needed, BUT, for optimal quality, DO NOT
resize the Abaqus animation, and DO resize the Matlab animation. For
some reason Corel RAVE does not properly set the size of the Matlab
animation when it is imported, so set it to match the height and width
values output by Matlab earlier. To do this, click on the Matlab animation
and then type in the appropriate numbers.

- Export the animation by selecting "File" --> "Export..." from
the menu. In the dialog box, change the file type to "AVI - Video
for Windows". Change "Compression Type:" to "Compression". Without compression
your file can be HUGE, maybe more than 100 MB! Name the file and then
click "Export". Be patient!

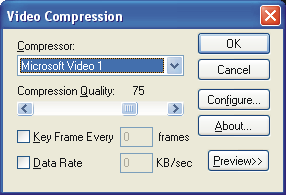
- Next you will be presented with the "Video Compression" dialog box.
Select "Microsoft Video 1", set the Compression Quality to "75", and
then select OK. Be patient!! Once its done, your final animation should
be complete and ready to insert into PowerPoint.
- All of the files used in this step-by-step demo can be found in this
folder.
|