
-
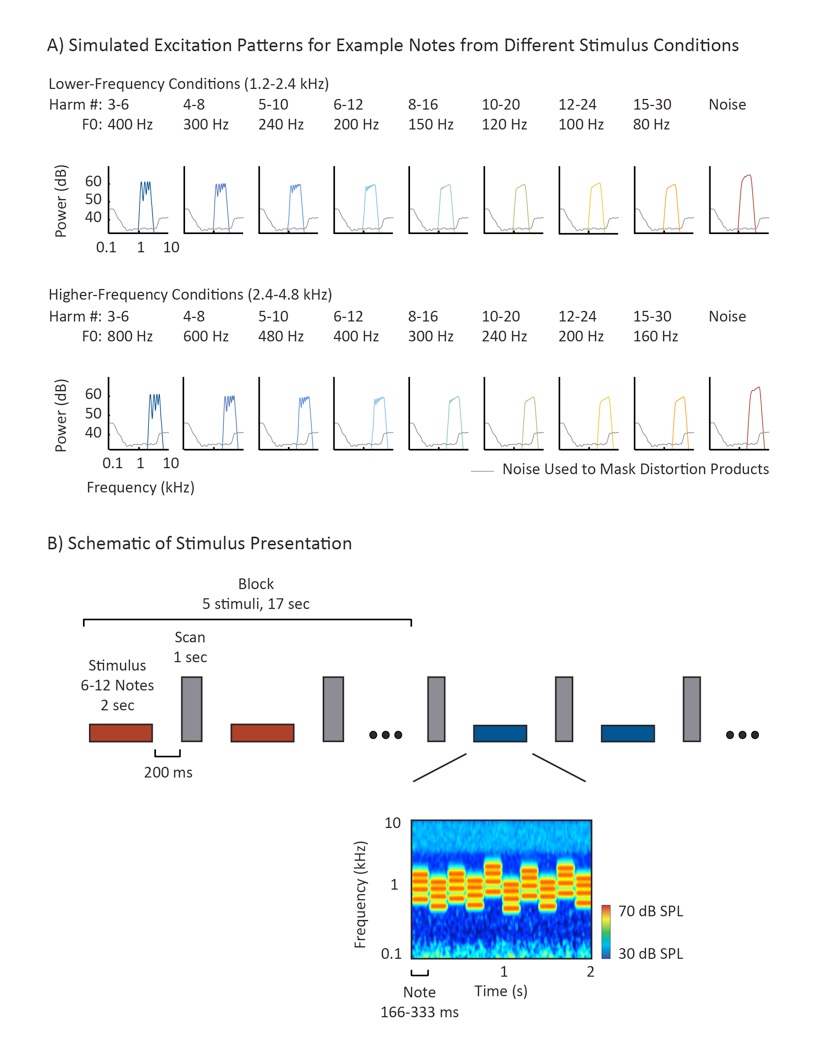
(A) The experiment included 16 harmonic conditions and 2 noise conditions (to provide a non-pitch, baseline). For the harmonic conditions, 2 frequency ranges (rows) were crossed with 8 sets of harmonic numbers (columns). Simulated excitation patterns illustrate the effect of harmonic number and frequency range on spectral pitch cues. As can be seen, the excitation peaks decrease in definition with increasing harmonic number (left to right), but are not greatly affected by changes in absolute frequency or F0 that do not alter harmonic number (top to bottom). Complexes with harmonics below the eighth are often considered resolved because they are believed to produce excitation peaks and troughs separated by at least 1 dB1. The spectrum level of the noise was increased by 5 dB relative to the harmonic conditions to equalize perceived loudness. Colored noise (gray line) was used to energetically mask distortion products (see Methods for details).
-
(B) Schematic of how stimuli were presented in the scanner. Stimuli (denoted by horizontal bars) were presented in a block design, with 5 stimuli from the same condition presented successively in each block (red and blue indicate different conditions). Scans (vertical, gray bars) were acquired during gaps of silence between stimuli to prevent the scanner noise from masking the stimuli (“sparse scanning”). Each stimulus was 2 seconds in duration and included 6–12 different “notes”. Notes within a given stimulus/condition varied in their frequency and F0 within a limited range as illustrated in the example cochleogram (plotting the magnitude of the cochlear response as a function of frequency and time). We varied the frequency/pitch of the notes because we found in pilot experiments that this enhanced the response of pitch regions (see Figure 8).
1Micheyl C, Keebler MV, Oxenham AJ (2010) Pitch perception for mixtures of spectrally overlapping harmonic complex tones. J Acoust Soc Am.