
-
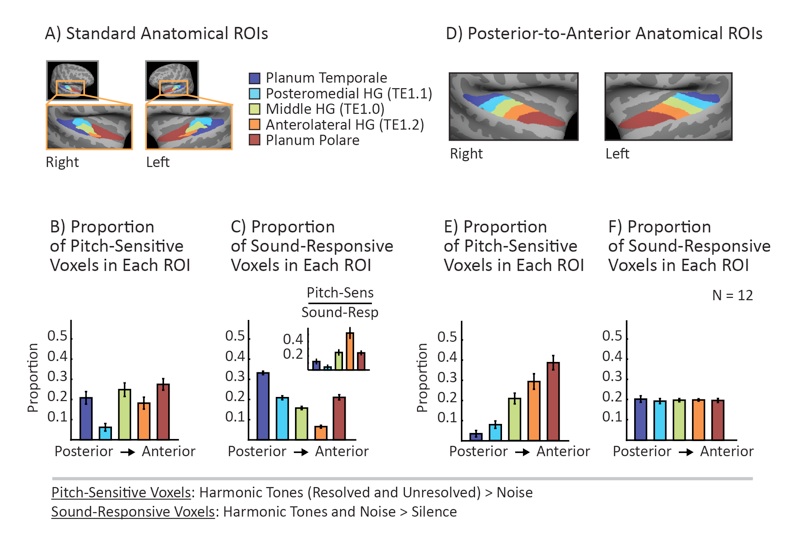
(A) Standard anatomical ROIs displayed on a mathematically inflated average brain.
-
(B) The proportion of all pitch-sensitive voxels falling within each ROI.
-
(C) For comparison with the distribution of pitch responses (panel B), this figure plots the proportion of all sound-responsive voxels falling within each ROI. The inset plots the proportion of sound-responsive voxels in each ROI that were also pitch-sensitive, and thus provides a measure of the density of pitch responses in each ROI. The anterior 3 ROIs showed the highest density of pitch responses, with a peak in anterolateral HG.
-
(D) Novel set of ROIs designed to run along the posterior-to-anterior axis of the superior temporal plane, and to each include an equal number of sound-responsive voxels. The anatomical ROIs can be downloaded here.
-
(E) The posterior-to-anterior ROIs revealed a monotonic gradient, within increasing numbers of pitch responses in more anterior regions.
-
(F) Each posterior-to-anterior ROI contained and equal number of sound-responsive voxels as intended.